
Election Forecast: What Our Models Tell Us About the 2024 U.S. Presidential Election
Advanced Models and Comprehensive Forecasts for the 2024 Election


As the 2024 U.S. presidential election approaches, our comprehensive forecasting models—Modus, Concordia, and Delphi—offer detailed insights into the race between Donald Trump and Joe Biden. By integrating historical data, economic indicators, recent polling data, and game theory we provide an accurate and nuanced prediction of election outcomes.
Modus Model: Methodology and Results
Data Collection: The model collects approval ratings, key economic indicators (GDP growth, unemployment rates, inflation rates, ISM Manufacturing Index), and historical election data. These factors are weighted based on their historical impact to calculate a composite score.
Composite Score Calculation: Using the following formula:
Composite Score
Given the data: Biden metrics
Approval Rating: 38
GDP Growth: 1.4
Inflation Rate: 3.5
ISM Index: 48.5
Unemployment Rate: 4
Polls: 44.2
We calculate:
Projected Two-Party Share: Using the formula:

Trump: 52.81%
Biden: 47.19%
Adjustment for Third-Party Candidates: Assuming hypothetical third-party candidates take 6% of the vote: Projected Final Score for Biden= 47.19 x 0.94 = 44.36%
Modus Dynamic Model: Methodology and Results
Data Collection: In addition to static data, the dynamic model incorporates recent polling data, focusing on the latest 10 polls to capture current trends.
Poll Data:
Trump: 49, 52, 44, 45, 48, 41, 48, 49, 44, 49
Biden: 43, 48, 43, 43, 45, 43, 44, 45, 44, 40
Polling Adjustment and Weighting: Recent polls are given higher weights using linear decay. The weights for the 10 polls are: 1, 2, 3, 4, 5, 6, 7, 8, 9, 10.
Weighted Averages:
Trump's Weighted Average: 47.16%
Biden's Weighted Average: 44.20%
Integration with Static Model: The final prediction combines the results from both models:

Combined Static and Dynamic Mode Two-Party Vote Share: Excluding third-party candidates:
Trump's Two-Party Vote Share: 52.2%
Biden's Two-Party Vote Share: 47.8%
Concordia Model Summary
Concordia Model: Methodology and Results
The Concordia model provides a comprehensive forecast for the 2024 U.S. presidential election by incorporating multiple factors and assigning weights based on their historical impact.
The model evaluates the following factors:
Approval Rating (Weight: 0.25): A higher approval rating correlates with higher re-election chances. Biden's approval rating of 38 contributes -3 to the composite score.
GDP Growth (Weight: 0.15): Economic growth is critical for re-election. With GDP growth at 1.4, the contribution is -0.165.
Inflation Rate (Weight: 0.15): Stable inflation rates (≤3%) are positive; higher rates (>3%) are negative. Biden's inflation rate of 3.5 contributes -0.075.
ISM Manufacturing Index (Weight: 0.15): An ISM index (≥50) signals economic expansion. Biden's ISM index of 48.5 contributes -0.225.
Unemployment Rate (Weight: 0.15): Lower rates (≤4.5%) are positive. Biden's unemployment rate of 4 contributes 0.075.
Polls (Weight: 0.15): Reflects voter intentions and sentiments. Biden's polling average of 44.2 contributes 6.63.
The total composite score for Biden is calculated as follows:
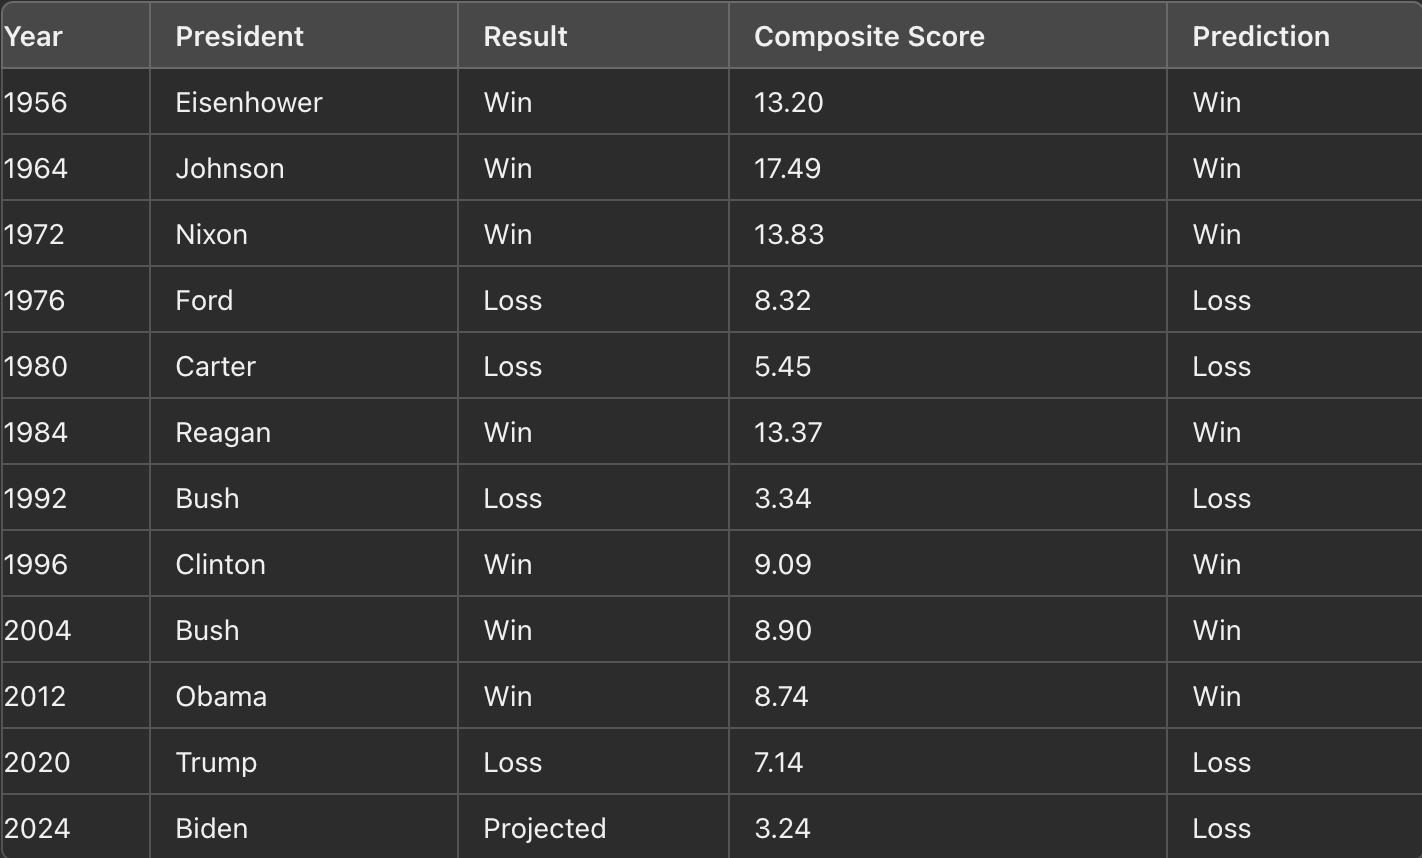
Threshold Determination: The threshold set by Concordia for predicting re-election success is set at a composite score of at least 8.74. Biden's composite score of 3.24 indicates a lower probability of re-election. For comparison, Bush Sr. had a composite score of 3.34 and Carter had a composite score of 5.45.
Threshold for Victory: 8.74
Biden's Composite Score: 3.24
Projected Result: Loss (since 3.24 is significantly below the threshold of 8.74)
Projected two party vote share based on composite score:
-Trump 52.9% to Biden 47.1%
Backtesting the Model
Using historical data for composite scores from past elections, let's estimate the probabilities of re-election:
Historical Mean Composite Scores:
Winners: Mean Composite Score = 12.09
Losers: Mean Composite Score = 6.06
The lowest winning score is 8.74 (Obama, 2012).
The highest losing score is 8.32 (Ford, 1976).
Conclusion:
Introducing Delphi: A Game Theory Framework
The Delphi framework is an innovative approach designed to predict election outcomes by integrating Bayesian Logistic Regression (BLR) and Sequential Game Theory. This framework combines statistical analysis with strategic decision-making.
Model Components:
Bayesian Logistic Regression (BLR): BLR models the probability of each candidate winning based on various predictors:
Economic Indicators: GDP growth, unemployment rate, cumulative inflation rate, household debt, household income.
Approval Ratings: Joe Biden's and Donald Trump's approval ratings.
Favorability Ratings: The favorability scores for both candidates.
Social Media Presence: The number of followers on major social media platforms.
Campaign Activities: The number of fundraisers, speeches, rallies, and interviews conducted by each candidate.
Sentiment Analysis: A sentiment score derived from public opinion and media analysis.
Next, these BLR-derived probabilities are integrated into the Delphi model, which uses game theory to simulate strategic interactions between the candidates. In this stage, candidates can adopt various strategies related to campaign effort and focus areas (e.g., national vs. battleground states). The model evaluates the payoffs for each strategy combination, taking into account the likely responses of the opposing candidate.
Monte Carlo Simulations: To account for uncertainty, Monte Carlo simulations provide a probabilistic estimate of each candidate’s likelihood of victory.
Results: The Delphi model and Monte Carlo simulations show:
Trump’s Probability of Victory: 88.9%
Biden’s Probability of Victory: 11.1%
Adjustments for Third-Party Candidates:
Trump’s Final Adjusted Vote Share: 52.3%
Biden’s Final Adjusted Vote Share: 47.7%
Combined Results
Our Election Models—Modus and Concordia—along with our war gaming model, Delphi, indicate that Trump is leading Biden with a combined average of +5 points. The combined models' two-party vote share is Trump 52.5% to Biden 47.5%.
Combined election probabilities show that Trump has a 79.7% chance to Biden’s 20.3% to win the National Popular Vote.
Trump has an 88% chance to gain an Electoral College Victory over Biden, who is at 12%. Trump remains the strong favorite to win the Electoral College, with projections between 306 and 341 electoral college votes to Biden’s 197 to 232 electoral college votes.
Conclusion
The Modus model, combining static and dynamic approaches, and the Delphi framework, integrating strategic decision-making, offer a robust forecast for the 2024 U.S. presidential election. Biden's composite score of 3.24 from the Concordia model indicates a challenging re-election path. The dynamic model's weighted averages and the Delphi framework's probabilistic analysis further highlight Trump's strong position. Our integrated final prediction for Biden's vote share with six percent hypothetical third party share is 44.6%, with a two-party share of 47.5% giving Trump a 5-point lead over Biden. These insights provide a comprehensive view of the election landscape, helping stakeholders make informed decisions as the election approaches.