
Presidential Exposure Model: July 2026 Midterms Outlook
Measuring Republican Midterm Exposure Through Approval, Partisan Swing, and Coalition Size

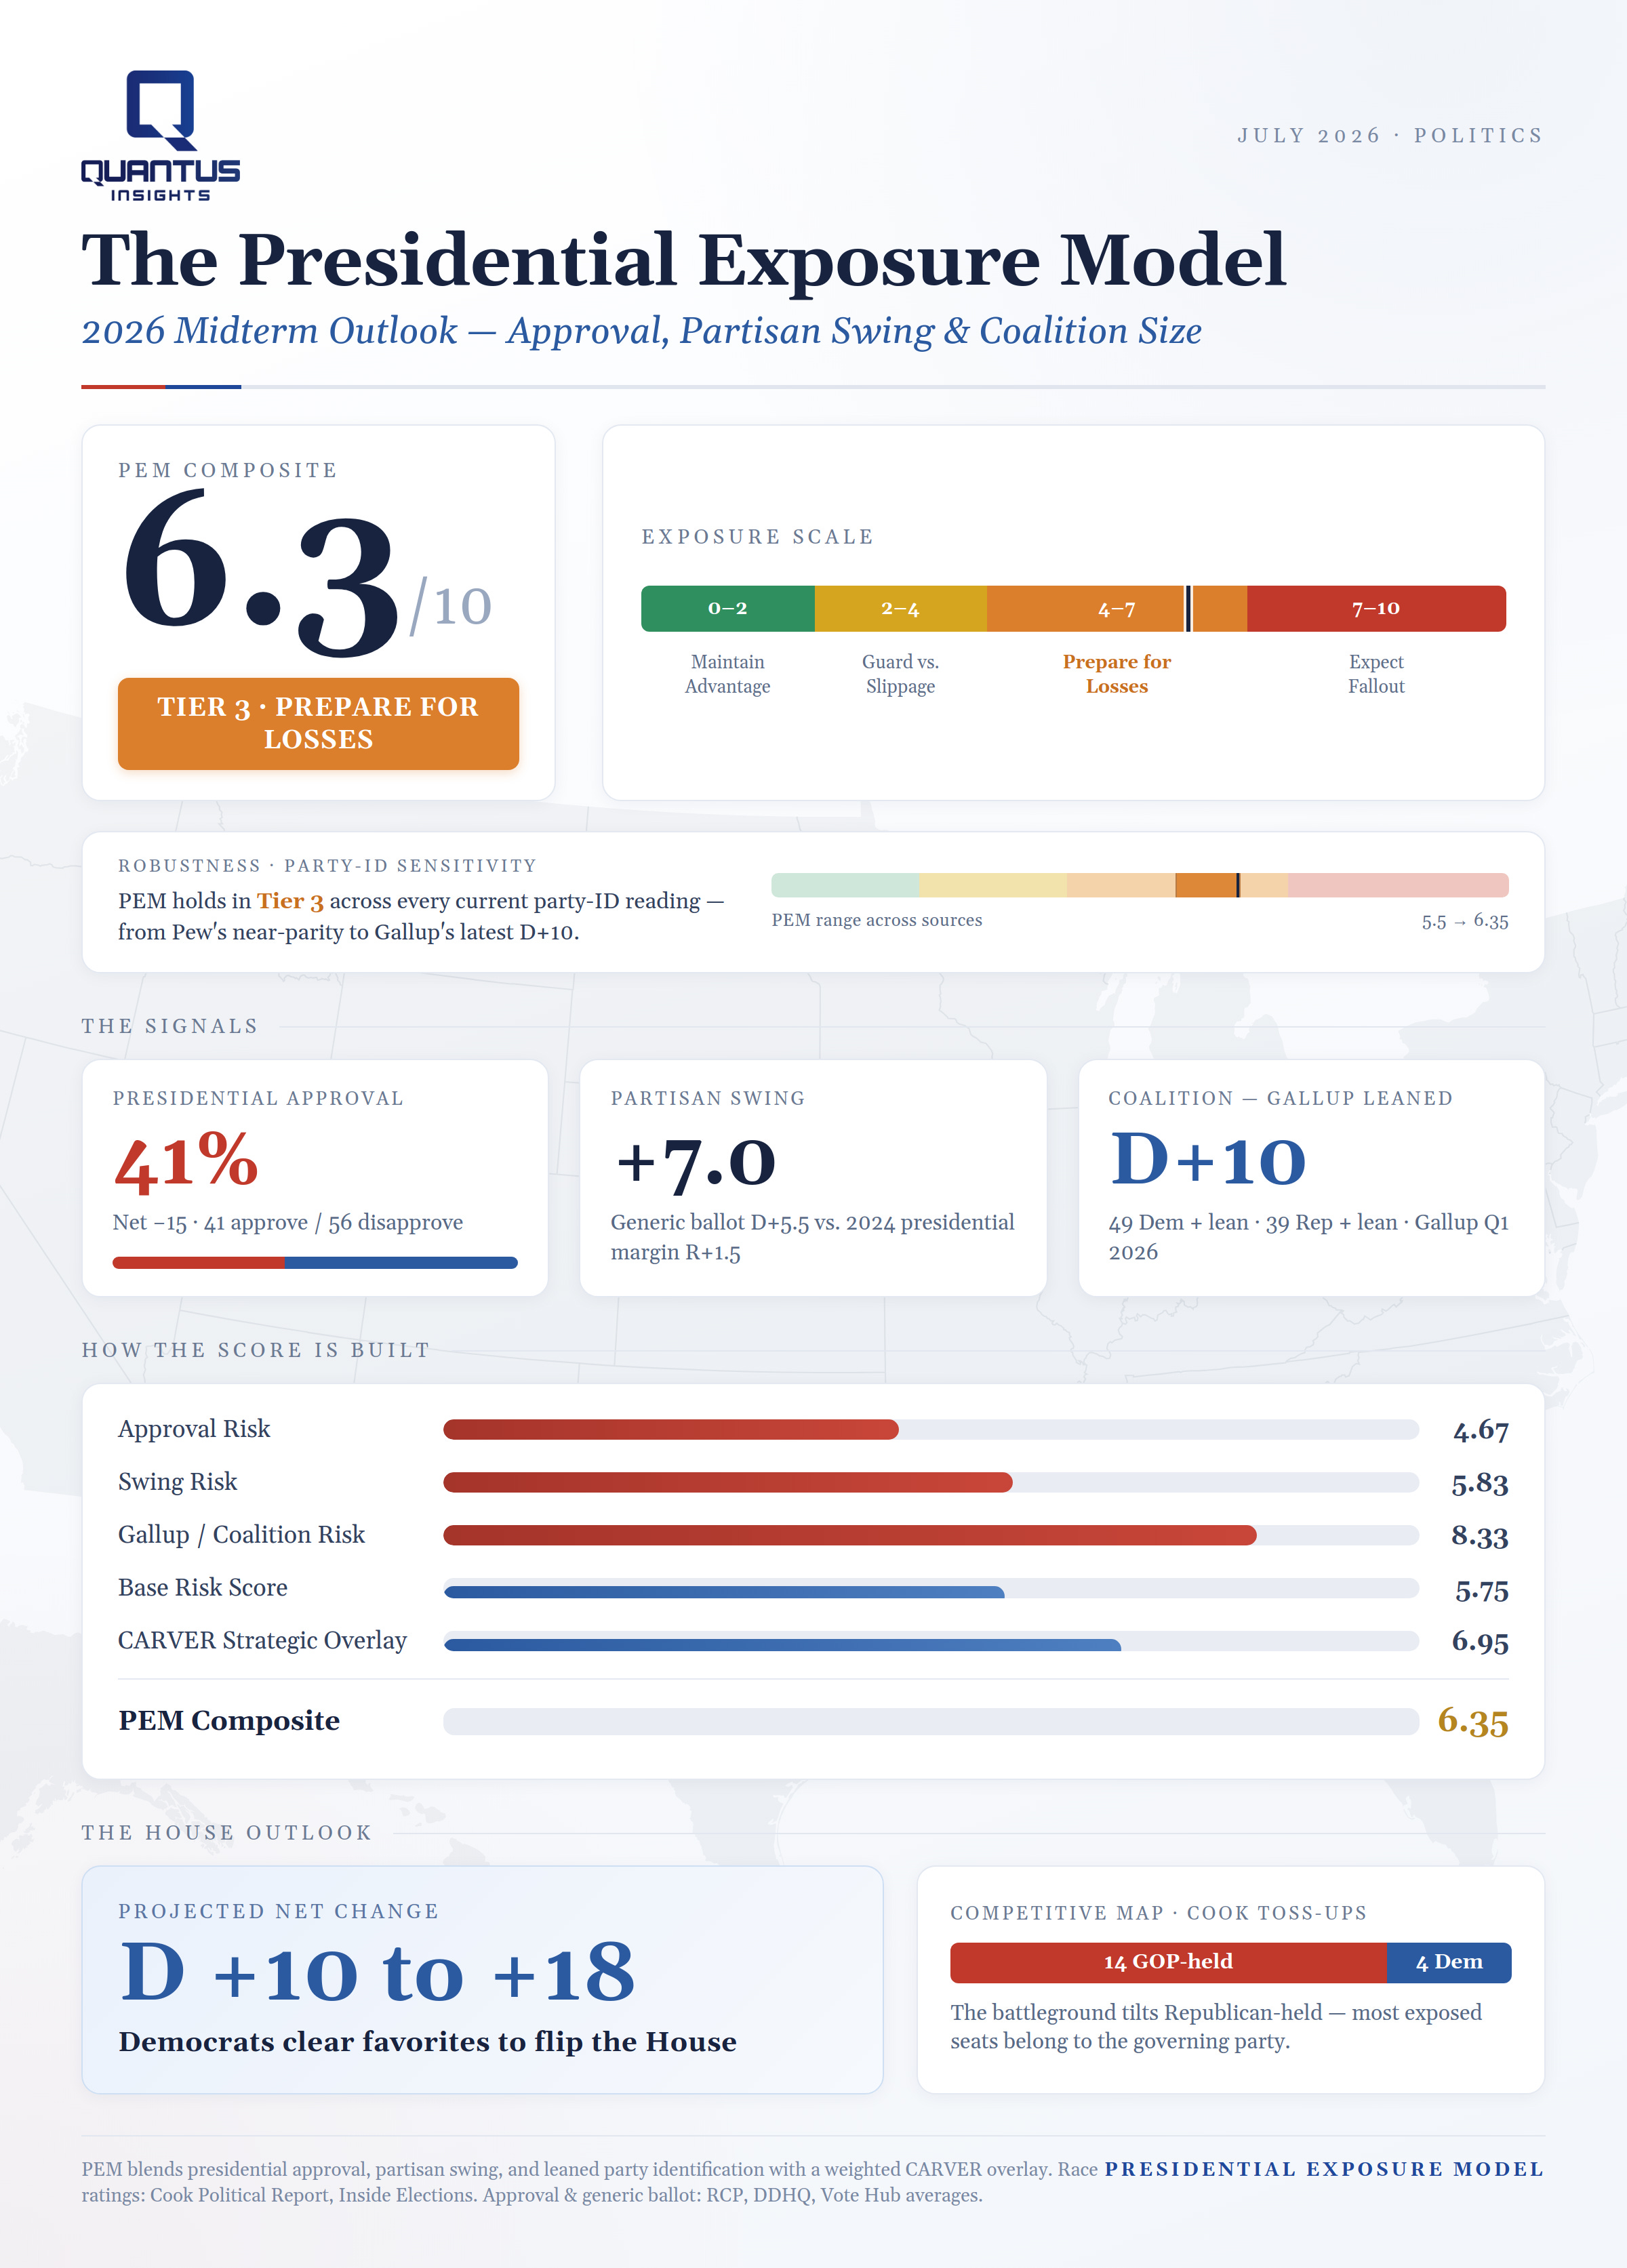
The Presidential Exposure Model (PEM) measures midterm electoral risk to the governing party by combining three national signals: presidential approval, partisan swing, and coalition size, with a CARVER-based strategic risk assessment overlay (read about the CARVER method here). Applied to the 2026 cycle, PEM returns a composite score of 6.3, placing the environment in Tier 3 (“Prepare for Losses”). Presidential approval near 41 percent, a seven-point partisan swing since 2024, and a double-digit Democratic advantage in leaned party identification together define a high-exposure cycle for Republicans. The competitive House map is consistent with a low-to-mid-teens Democratic gain, making Democrats clear favorites for control of the chamber. (See our January PEM update here).
Introduction
Midterm elections operate as national referenda on presidential performance. Since World War II, the party controlling the White House has lost House seats in 17 of 19 midterms. Presidential approval has consistently been the single strongest predictor of the result, but it is not the whole story: the direction of the electorate and the size of the opposition coalition determine whether a difficult cycle becomes a wave.
PEM integrates all three. Approval measures pressureon the incumbent; partisan swing measures direction; and Gallup party identification with leaners measures coalition size — how large and energized the opposition bloc is relative to the governing party. A CARVER strategic overlay then captures the non-polling vulnerabilities that shape how those signals translate into seats.
The Framework
Base Risk Score (BRS). The quantitative core blends the three national signals, each scaled 0–10:

The National Swing Factor (NSF) is the shift in the generic congressional ballot relative to the prior presidential margin, so SwingRisk rewards momentum rather than a static lead. GallupRisk scales the leaned party margin — Democrats-plus-leaners minus Republicans-plus-leaners — capturing the turnout-driven dimension that approval alone misses. Each component is capped to prevent any single signal from dominating.
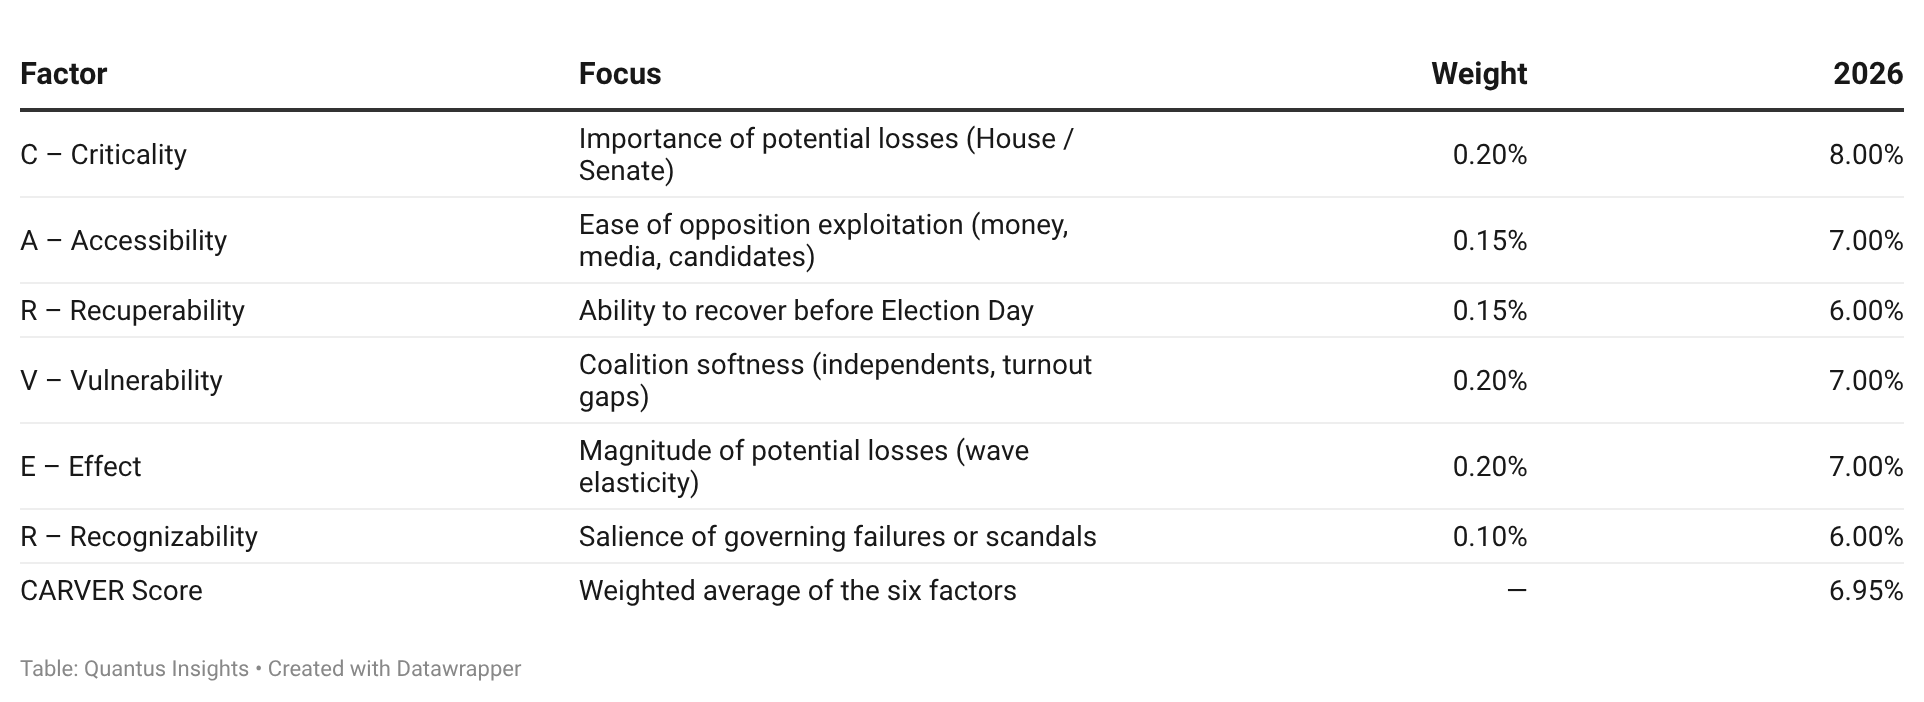
CARVER Strategic Overlay. To move beyond polling, PEM applies a weighted six-factor assessment of structural vulnerability:
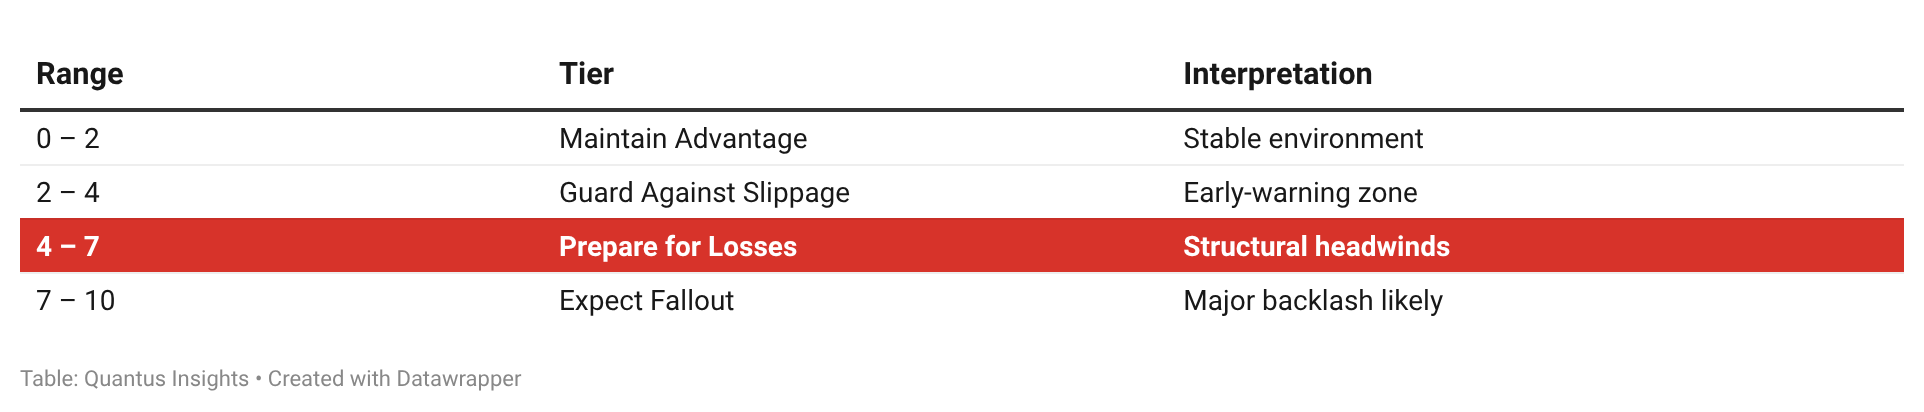
Composite. PEM = 0.5·BRS + 0.5·CARVER. Scores map to four exposure tiers:
Findings
Approval anchors the model. Across modern midterms (1994–2022), presidential approval correlates with House seat change at approximately r = 0.55, and the relationship sharpens as approval falls below 50 percent. Each point below that line is associated with roughly 2.5 additional House seats lost. Approval below 45 percent has reliably preceded substantial losses.
Coalition size adds independent signal. Gallup party identification with leaners tracks the House popular-vote margin closely across modern midterms (r ≈ 0.75), measuring the size and energy of the opposition bloc rather than restating approval or swing. Because midterm outcomes are driven as much by turnout asymmetry as by persuasion, coalition size carries information the other two signals cannot.
Large coalitions produce waves. When the opposition’s leaned advantage exceeds roughly five points, exposure tends to compound: turnout and backlash dynamics amplify losses beyond what a linear read of approval alone would predict. This threshold behavior is why some midterms yield modest losses and others generate waves.
2026 Application
Current indicators: presidential approval ~41%(net ‒15); generic ballot D+5.5; Gallup leaned party ID D+10 based on January 2026 release; a +7-point swing from the 2024 presidential margin.
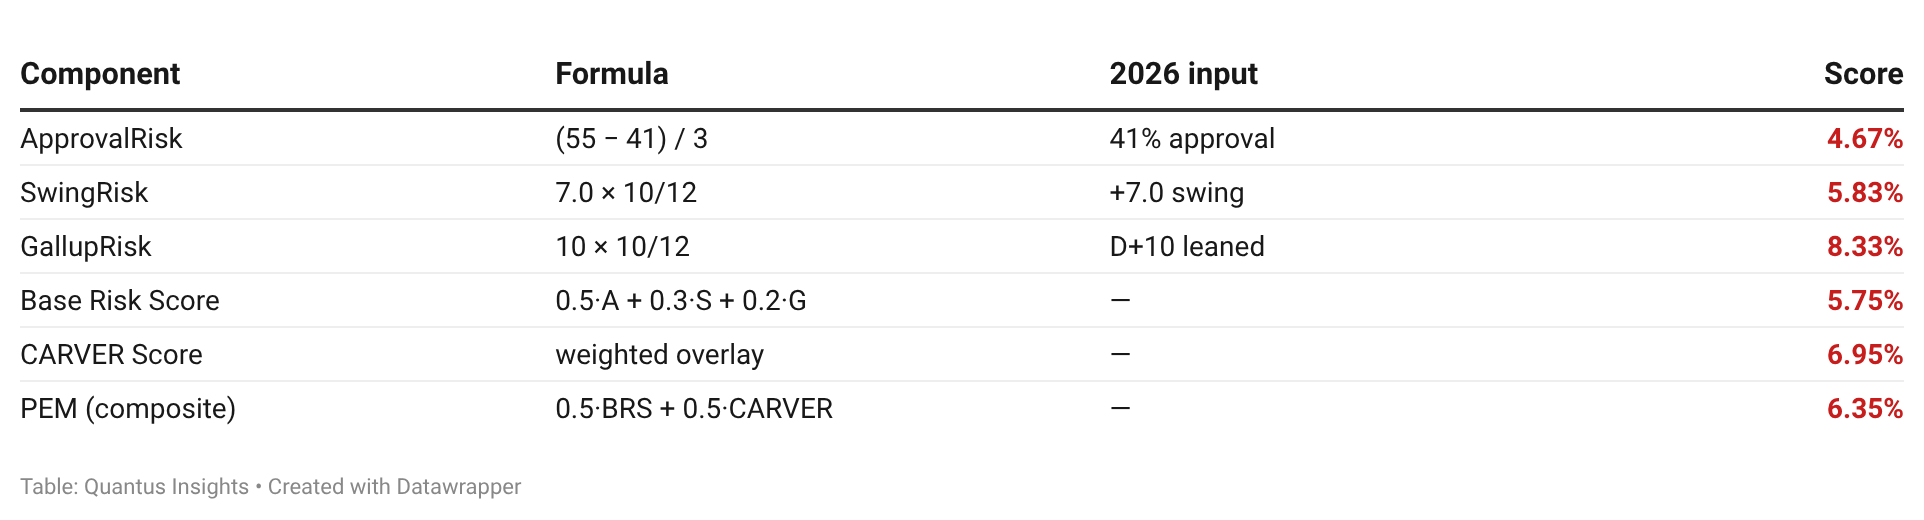
Result: PEM = 6.3 — Tier 3, “Prepare for Losses.” The reading is stable across a reasonable range of CARVER assessments, remaining within Tier 3 throughout.
Robustness: Party Identification
Coalition size is the model’s most movable input, and the major trackers of party identification differ. To test how far the 2026 reading depends on that choice, PEM is recomputed across the full range of current party-identification measures, holding approval and swing fixed:
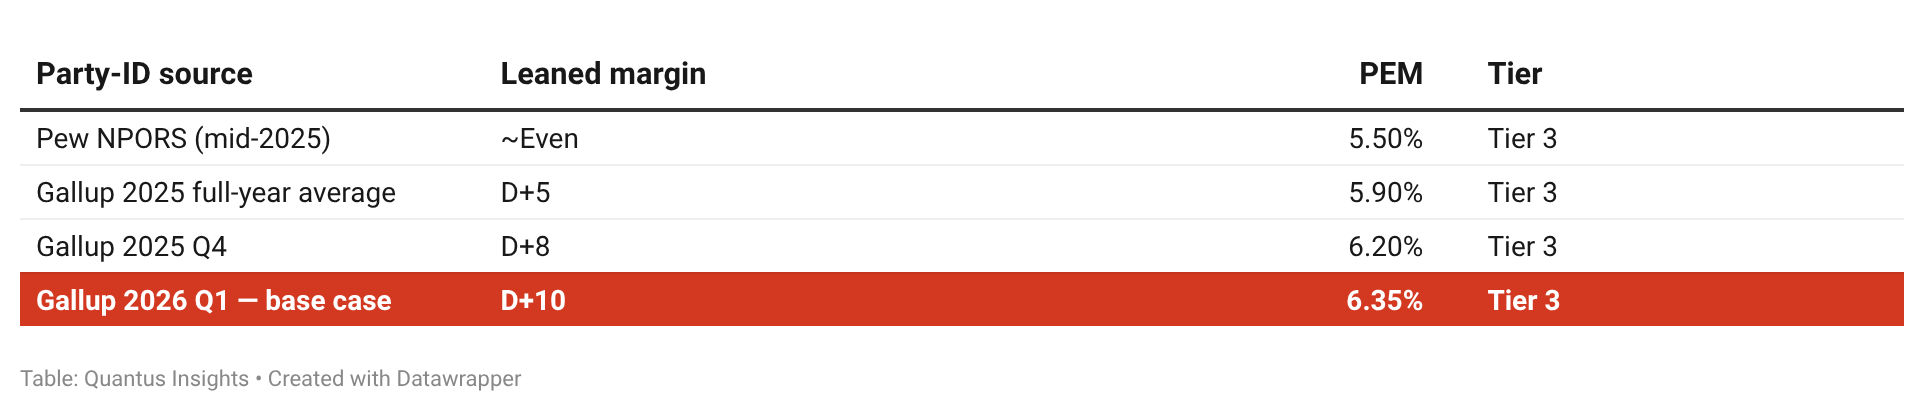
Across every current reading — from Pew’s near-parity to Gallup’s most recent D+10 — the environment remains in Tier 3. The classification does not depend on which tracker is used; only the reading’s position within the band shifts.
The distance between the two houses is largely a matter of timing rather than method. Pew’s most recent detailed party-identification reading covers early-to-mid 2025; Gallup’s runs through the first quarter of 2026, a span over which the Democratic leaned advantage widened from roughly even to D+10. Measured over the same window the two instruments sit within two to three points of one another, with Pew running modestly more Republican. Gallup’s leaned margin has moved toward Democrats across five consecutive quarters from R+4 in late 2024 to D+10 in early 2026. So if the point-in-time input errs, it is more likely to understate Republican exposure than to overstate it.
The House Outlook
The competitive map corroborates the model. Independent race ratings (Cook Political Report, Inside Elections) show Republican-held seats dominating the battleground: 14 of Cook’s 18 toss-ups are Republican-held, with additional GOP exposure in the Lean and Likely Republican columns, while Democratic exposure is comparatively limited. Inside Elections shows the same shape.
A seat count across this terrain points to a net Democratic gain in the low-to-mid teens, past the handful of seats Democrats need to take control. The top-down exposure score and the bottom-up map read arrive at the same place: a genuinely contested House with the structural wind at Democrats’ backs.
Discussion
PEM functions as an early-warning dashboard. Approval sets the floor, swing establishes direction, and coalition size determines whether exposure stays linear or amplifies into a wave; the CARVER overlay grounds those signals in the structural realities — coalition composition, scandal salience, map exposure — that temper or magnify raw polling. Idiosyncratic cycles remain possible: candidate quality and salient issues can moderate an approval-driven environment, as 2022 demonstrated. But when approval sits in the low 40s and the opposition holds a swing above five points and a double-digit coalition edge, the probability of significant losses rises sharply.
Conclusion
Presidential approval remains the pulse of midterm politics; partisan swing sets its direction; coalition size decides its magnitude. For 2026, all three point the same way. Unless approval rebounds toward 50 percent or the Democratic coalition advantage narrows materially, PEM places Republicans in a high-exposure cycle: Tier 3, Prepare for Losses, with control of the House realistically at risk.