


Projected Election Outcome Based on Recent Polling Data
Forecasting the Election: Trump’s Advantage in Polls and Projections

Introduction
Recent polling data aggregated by RealClearPolitics (RCP) has provided significant insights into the projected outcomes of the upcoming presidential election. Based on the last 12 polls in the RCP aggregate, Monte Carlo simulations have been employed to analyze the potential results. This essay delves into the statistical analysis, highlighting the probabilities of each candidate's success and providing a comprehensive view of the current electoral landscape.
Monte Carlo Simulations and Probabilities
Monte Carlo simulations, a robust statistical method, have been used to project the election outcome. These simulations involve generating a large number of random samples based on the mean and standard deviation of the polling data for both candidates. The results are as follows:
Donald Trump has a significantly higher probability of winning the election, with a 77.07% chance.
Joe Biden has a 22.93% chance of winning.
Simulation Details:
Joe Biden: 49.79% of the simulated polling results for Biden are less than or equal to his mean polling result (44%).
Donald Trump: 50.31% of the simulated polling results for Trump are less than or equal to his mean polling result (47.33%).
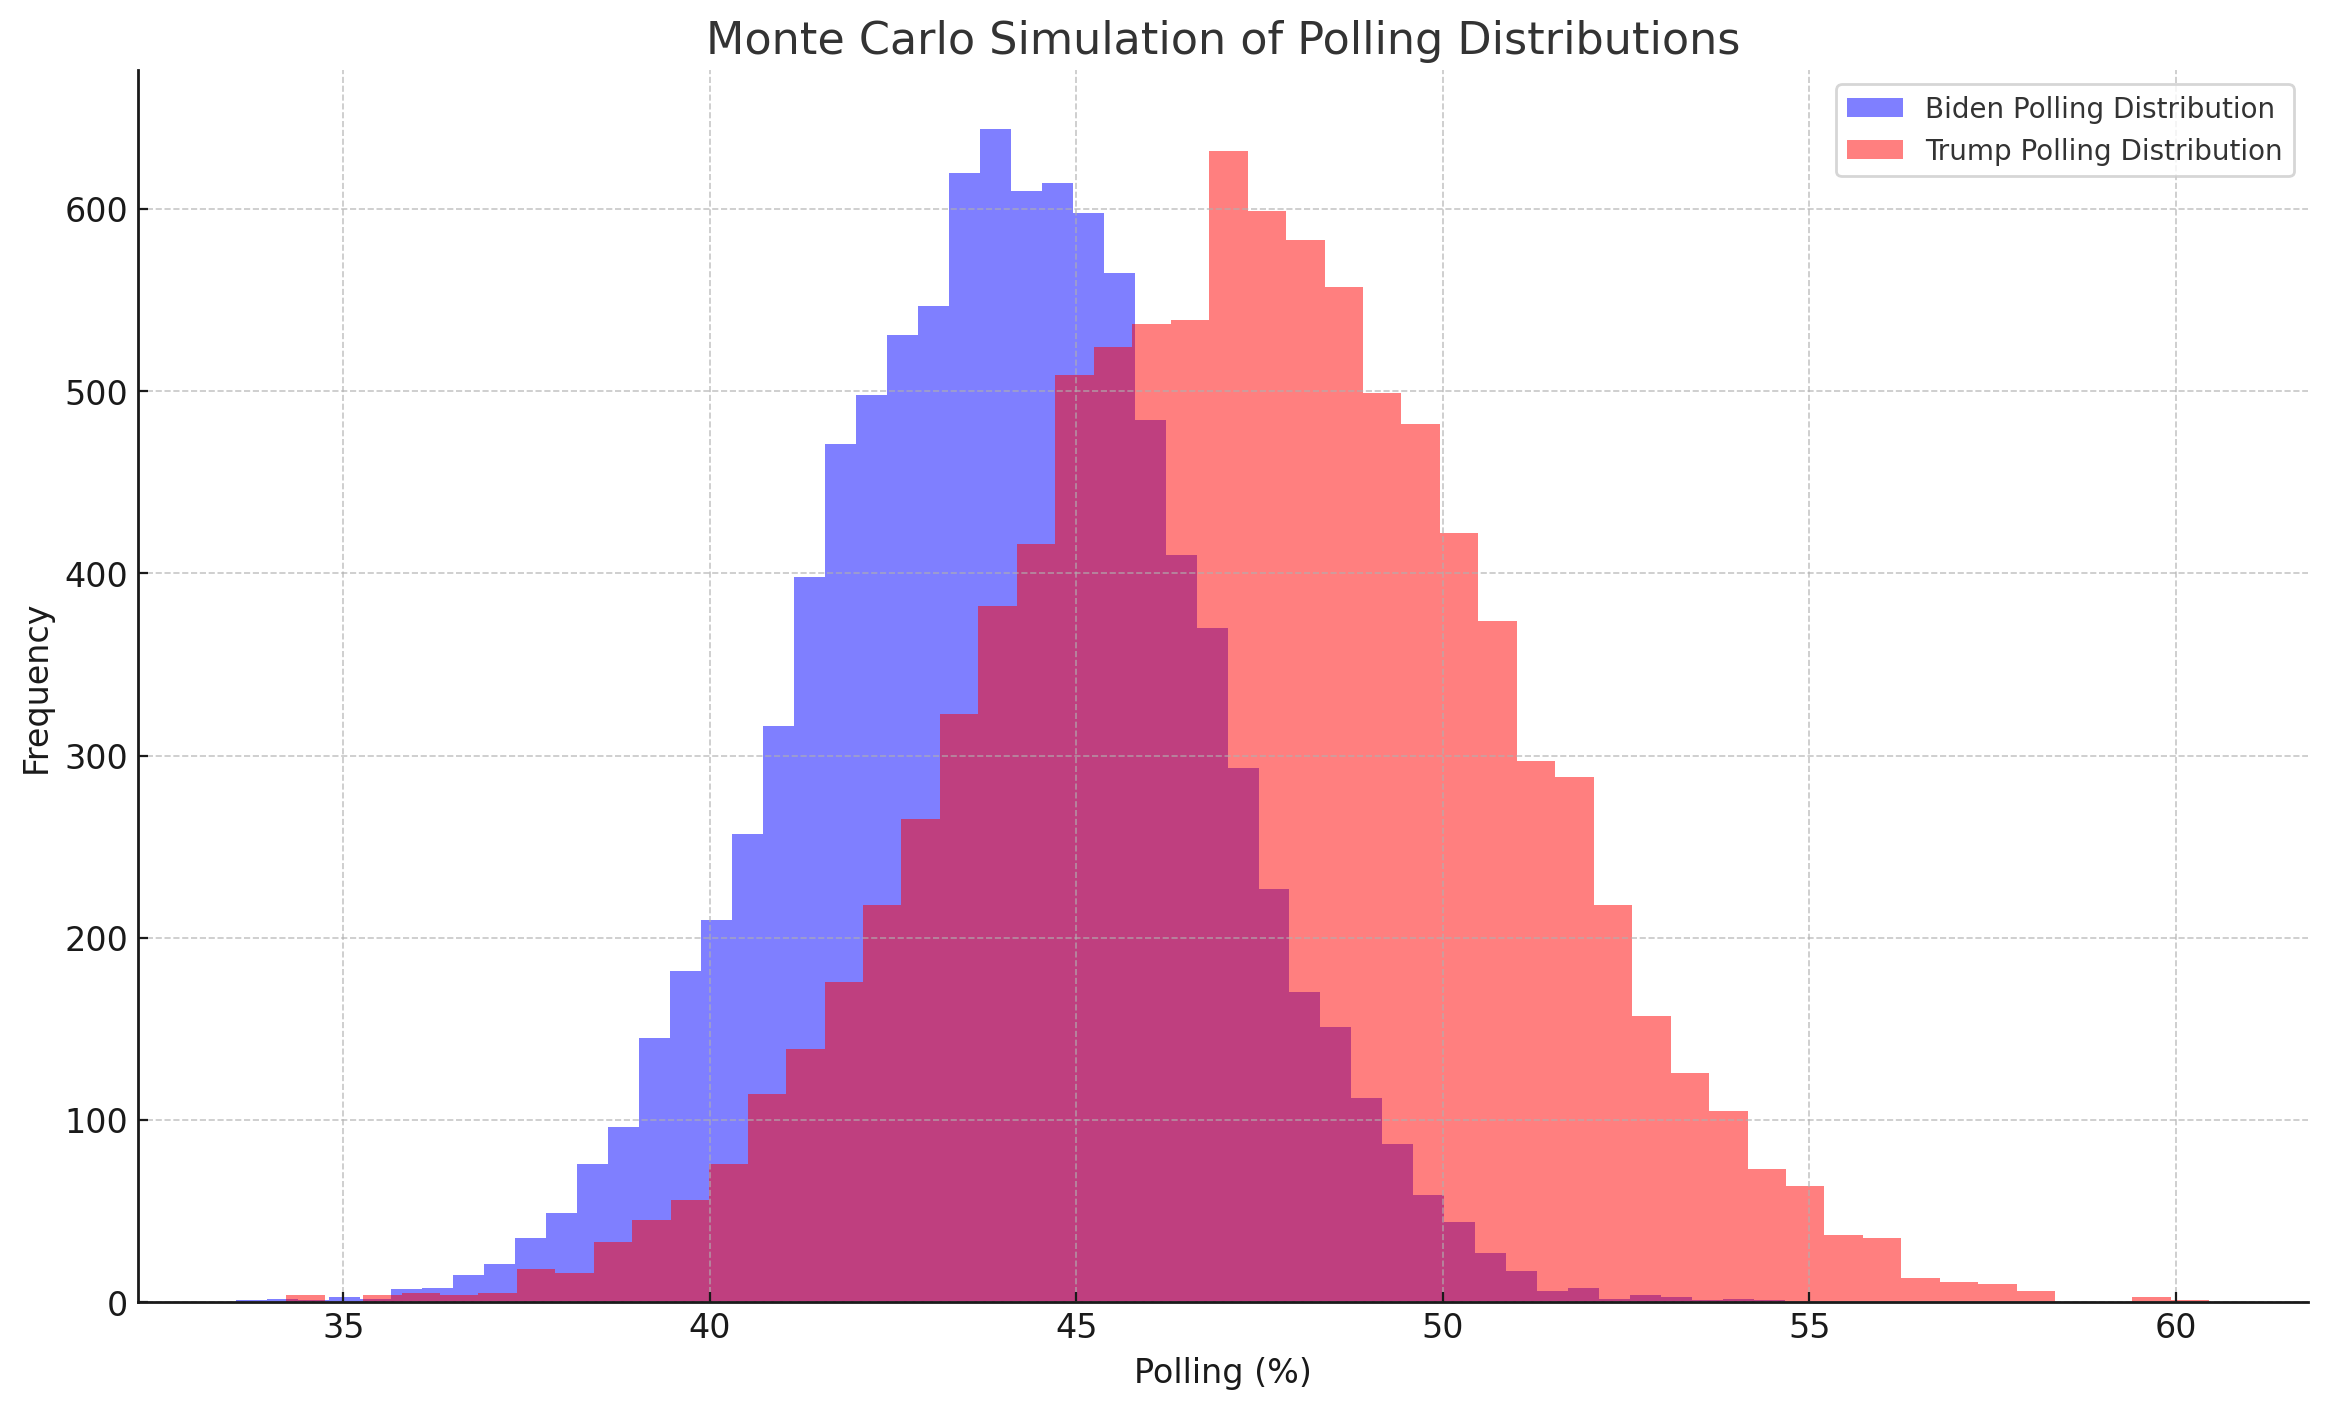
Both Biden and Trump are positioned very close to the middle of their respective polling distributions. This positioning indicates that their mean polling results are good representations of their central tendencies according to the simulations.
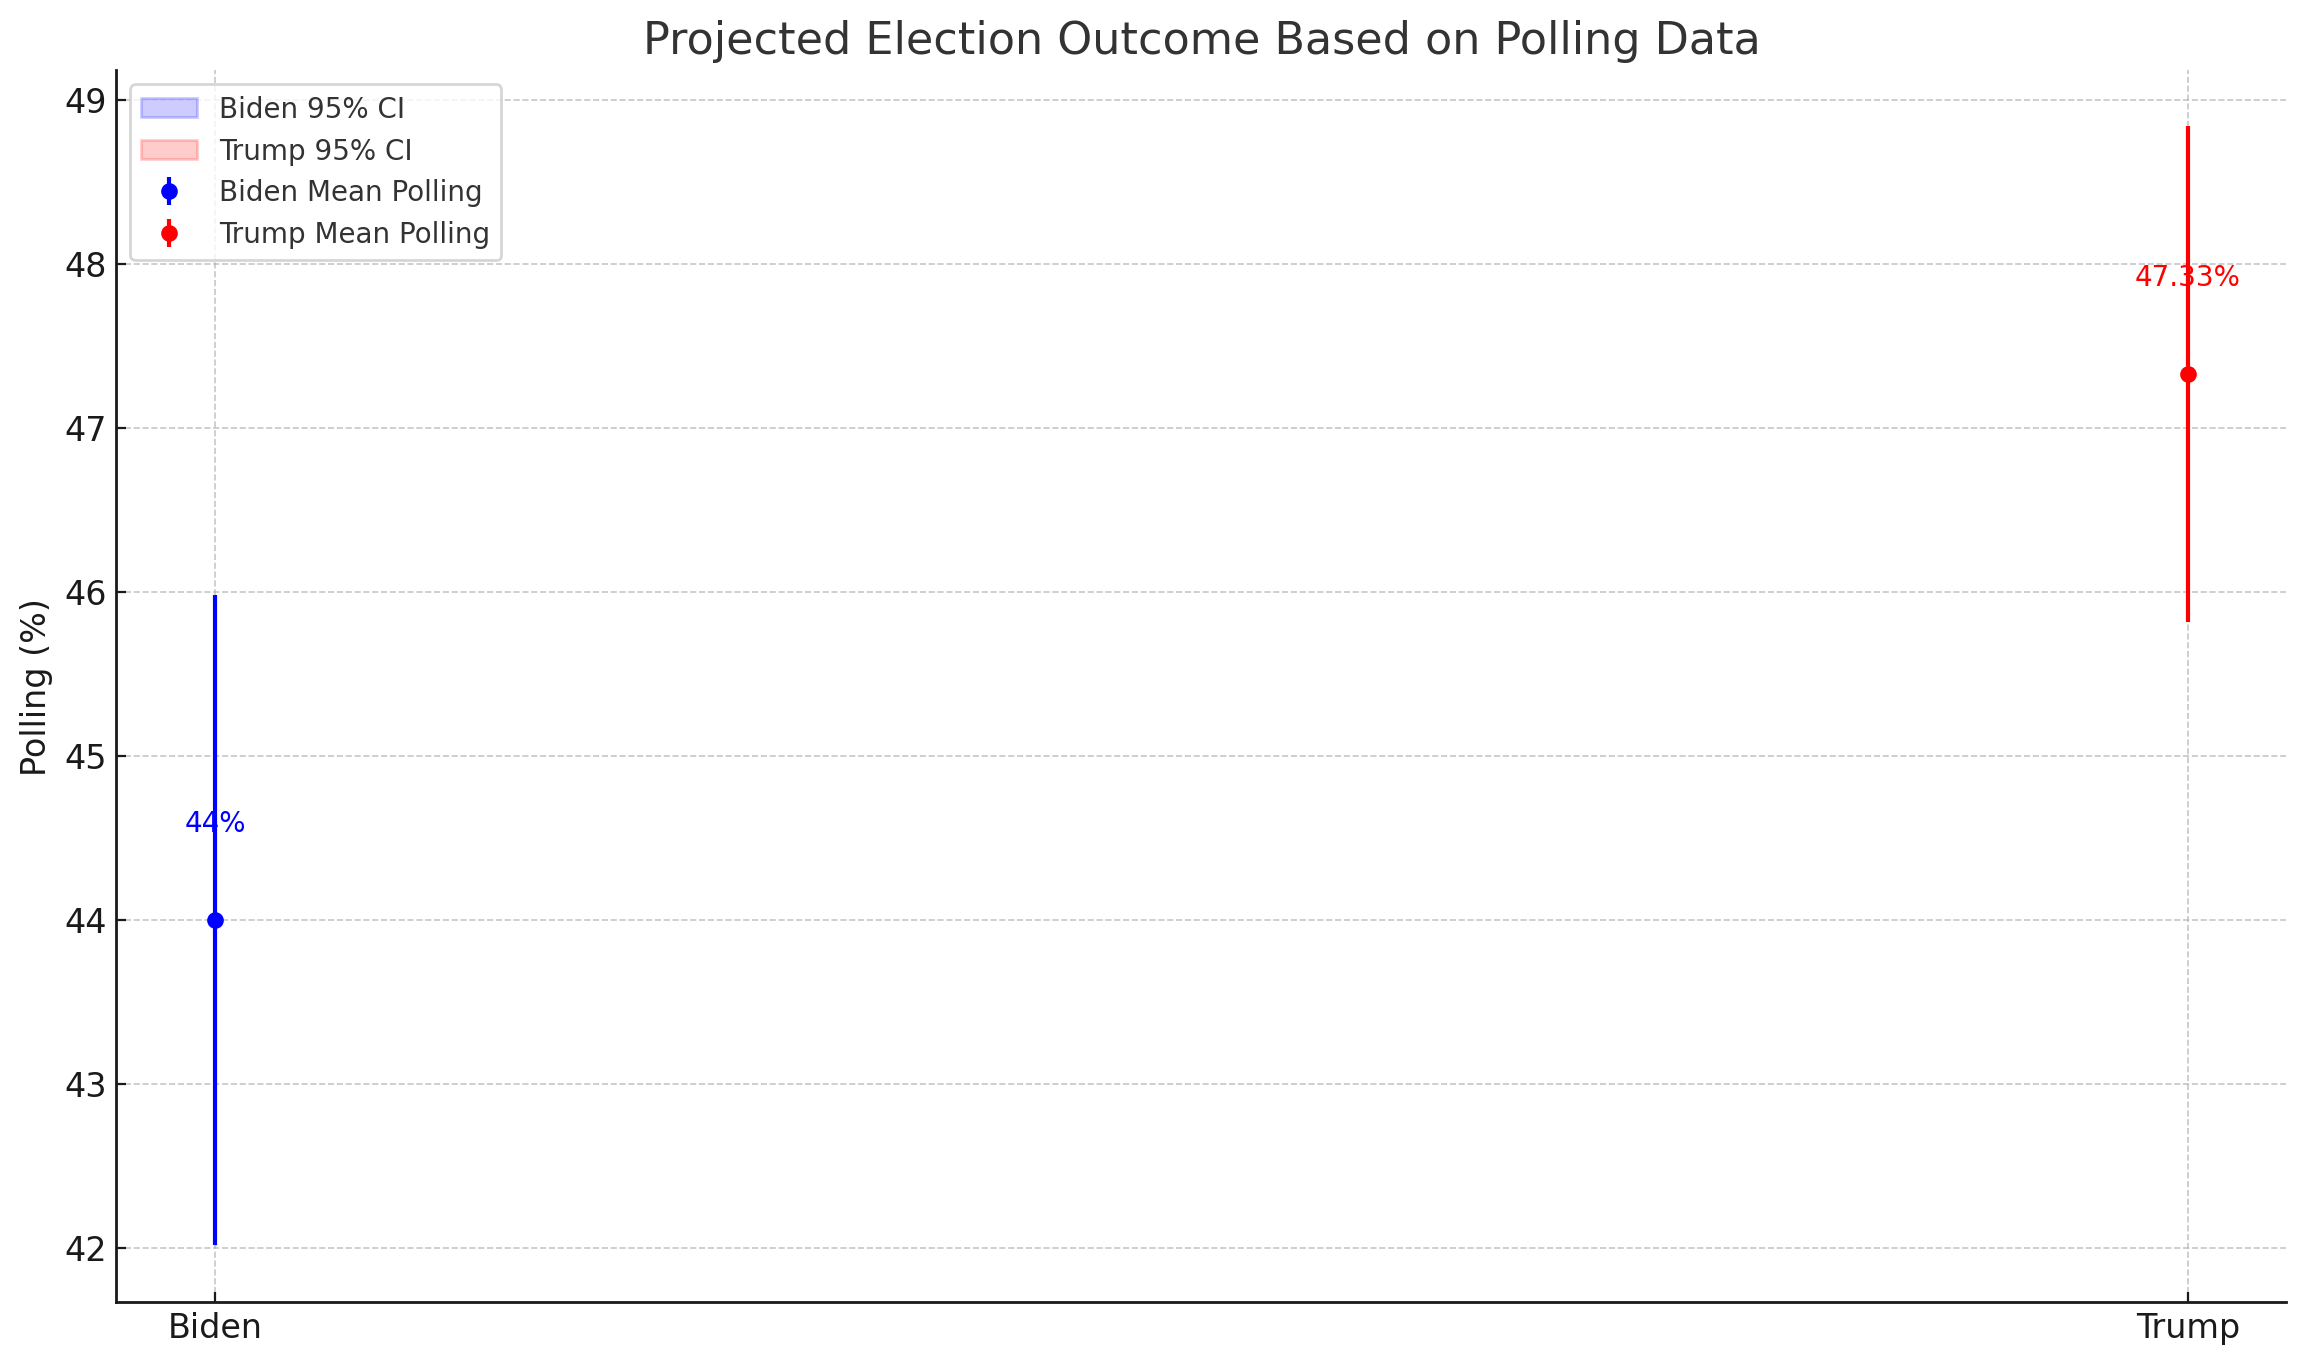
Projected Election Outcome
The following statistics provide a detailed projection of the election outcome based on the mean polling results and the margin of error:
Joe Biden:
Mean Polling: 44%
Margin of Error: ±1.98%
95% Confidence Interval: 42.01% to 45.98%
Donald Trump:
Mean Polling: 47.33%
Margin of Error: ±1.51%
95% Confidence Interval: 45.82% to 48.84%
Visual Analysis
The accompanying visuals, which include histograms and error bar plots, illustrate the distribution of polling numbers and the projected confidence intervals for both candidates. These visuals highlight the spread and overlap of the polling results, emphasizing Trump's higher average and the tighter clustering of his polling numbers within the confidence intervals.
Conclusion
Based on the analysis of the recent RCP polling data and the results of the Monte Carlo simulations, Donald Trump currently holds a substantial lead over Joe Biden in terms of projected election outcomes. With a 77.07% probability of winning, Trump's polling advantage is evident. On the other hand, Joe Biden's chances, though notable at 22.93%, reflect a more challenging path to victory.
The statistical analysis underscores the importance of continuous monitoring of polling data and the dynamic nature of electoral projections. As the election approaches, these probabilities may shift, necessitating ongoing analysis to capture the evolving sentiments of the electorate.
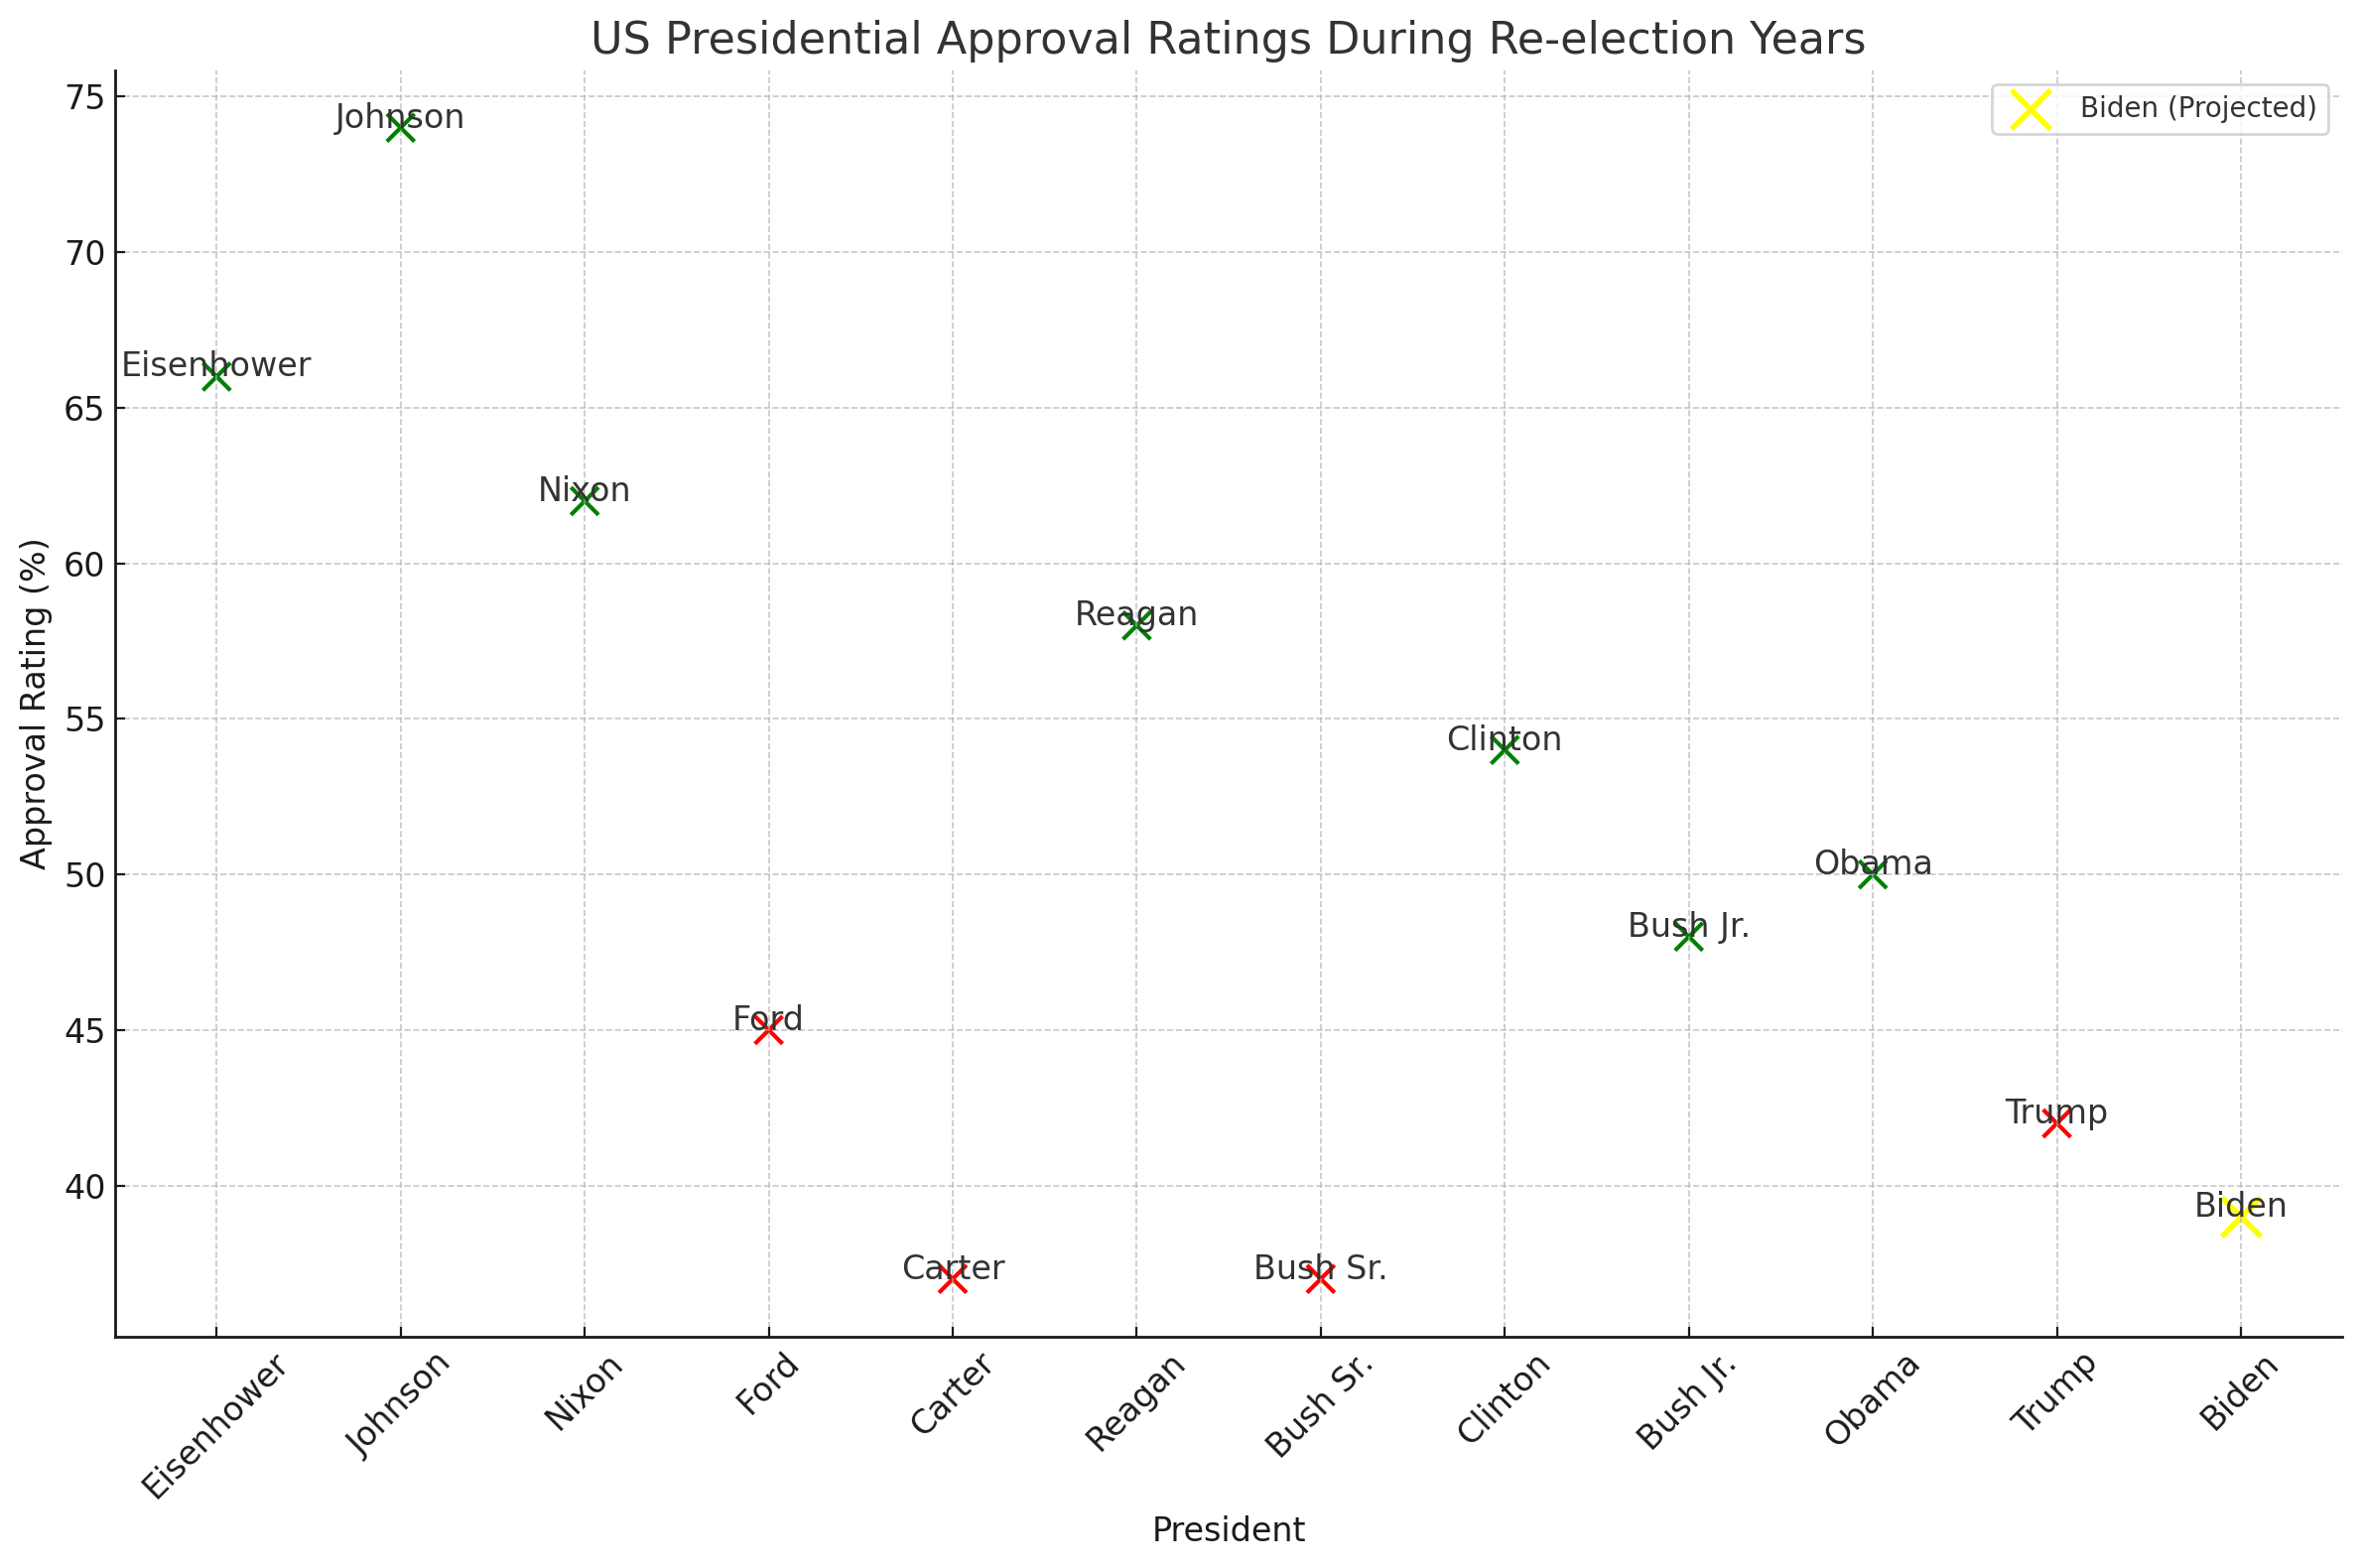
Approval Ratings and Historical Context
In comparison to historical presidential approval ratings during re-election years, Joe Biden's current polling numbers place him in a challenging position. Historical data suggests that presidents with similar approval ratings during their re-election campaigns have faced significant difficulties in securing another term. This context further solidifies the analysis that Biden is in a precarious situation, approaching what can be considered a territory of certain defeat.
Final Remarks
The use of Monte Carlo simulations provides a rigorous framework for understanding the potential outcomes of the upcoming election. By analyzing the central tendencies and the distribution of polling results, we gain a clearer picture of the electoral landscape and the probabilities of each candidate's success. The accompanying visuals serve to enhance this understanding, offering a detailed and accessible representation of the data.