
The Polling Crisis: Accuracy, Bias, and Reform in U.S. Political Surveys (2000–2024)
How Systemic Bias and Gatekeepers Broke U.S. Polling –– And How to Fix It

Executive Summary
American political polling is in a death spiral. For three presidential cycles (2016, 2020, 2024), polls have consistently overestimated Democratic support by an average of 4.2 points in battleground states, creating a false reality that misguides campaigns, manipulates voters, and erodes trust in democracy. This is no accident—it’s a structural failure driven by collapsing response rates, nonresponse bias, industry gatekeepers and flawed grading systems propped up inaccurate pollsters while discrediting innovators. While new firms like Quantus Insights achieved near-perfect accuracy in 2024 (0.7-point national error, 1.0-point error in key states), the industry remains broken, simulating consensus rather than measuring reality. We expose these failures, from presidential races to down-ballot contests, and propose industry reform and structural overhaul: behaviorally grounded models, advanced statistical corrections, industry standards, and transparency to dismantle gatekeeper influence. Without reform, polling will continue to fuel distrust and undermine elections (AAPOR, 2021; AFI Scorecard, 2024).
1. The Broken Mirror: Polling’s Role in Democracy
Polling is meant to be democracy’s pulse, measuring public opinion, guiding campaigns, and holding institutions accountable. George Gallup called it a mirror of the electorate; V.O. Key saw it as a check on elite claims (AAPOR, 2023). But these roles depend on sound methodology, representative sampling, and neutrality. When these fail, polling becomes a simulation engine, projecting elite assumptions rather than reflecting voter will.
Today, response rates have crashed from 20% in 2000 to 5% in 2024, skewing samples toward urban, college-educated, institutionally trusting voters (AAPOR, 2024). Gatekeepers like Nate Silver and FiveThirtyEight (now defunct) amplify this bias, endorsing flawed pollsters while dismissing accurate ones, creating a feedback loop of error and distrust. Public confidence in polls has plummeted from 38% in 2000 to 22% in 2024, mirroring media distrust at 60% (Gallup, 2024; Edelman, 2024). This is an epistemological crisis: polling no longer measures—it manufactures. Restoring its role demands rigor, transparency, and a rejection of gatekeeper orthodoxy (Pew, 2023).

This is not a technical flaw. It is an epistemological one. And it demands not just methodological adjustment, but a ground-up reform of what public measurement is supposed to be.
As public trust in institutions has eroded, the sample of Americans willing to participate in surveys has become increasingly unrepresentative. This asymmetry is not random. It is structured—and it has turned polling into a feedback loop between elite cues and media narratives.
2. The Arc of Collapse: Systemic Bias in 2016, 2020, and 2024
From 2000 to 2012, polling was reliable, with national errors averaging 1.5 points and no partisan bias. Since 2016, errors have grown, become directional, and consistently favored Democrats, revealing a structural crisis.
2.1 The Era of Equilibrium (2000–2012)
Polls used live-caller surveys, random-digit dialing, and 20% response rates, achieving 1.5-point national errors (AAPOR, 2000). State-level errors (e.g., Ohio 2004 overestimating Kerry, Florida 2012 favoring Romney) were random, not systemic. Public trust was high at 38% (Gallup, 2000). This stability relied on landlines and civic engagement, which eroded by 2016 as response rates fell to 9% (AAPOR, 2016).
During this period, polling organizations worked under fairly homogeneous methodology: live-caller phone interviews, random-digit dialing, and fairly high response rates—in excess of 20%. Response quality during the period, as measured by the data of AAPOR, was strong enough to produce inferential validity. The average voter was contactable, and survey weighting procedures had not yet been overmatched by demographic non-response.
The tipping point, however, did not come due to one bad poll, but rather due to a structural change both in the electorate and the technology of measuring it. The post-2016 period did not just have more errors, but a different type of error: persistent, directional, and politically consequential.
2.2 2016: The Structural Break
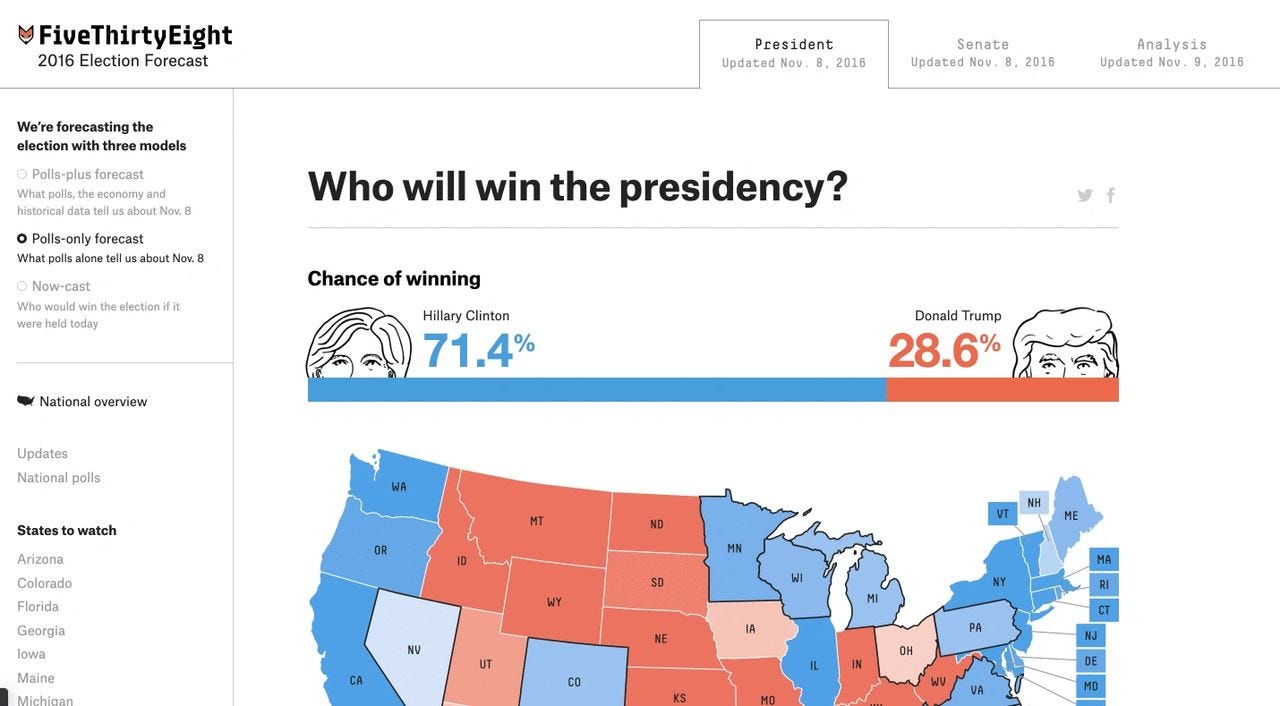
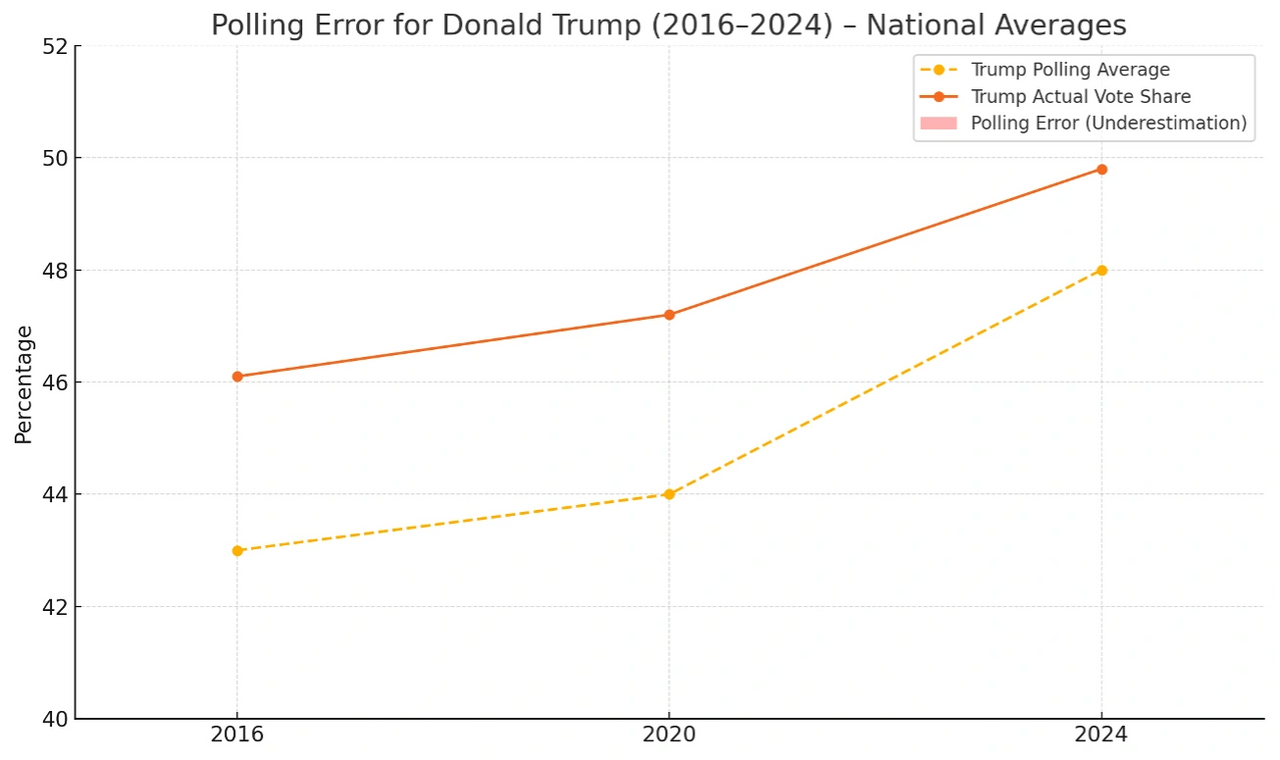
In 2016, polls predicted a Hillary Clinton win by 3–4 points nationally; she won the popular vote by 2.1. State errors were catastrophic: Wisconsin (Clinton +6.5, Trump +0.7), Michigan (Clinton +3.6, Trump +0.2), Pennsylvania (Clinton +2.1, Trump +0.7). Nearly every major model predicted a Clinton victory. FiveThirtyEight gave her a 71% chance. The New York Times’ Upshot gave her 85%. The Princeton Election Consortium predicted over 90%.
News organizations, plugging in these polls and models, reported Clinton's victory as practically guaranteed. Voter turnout models, campaign budget allocations, and even psychological expectations of voters were informed by this skewed mirror. Yet Donald Trump won the presidency with victories in key Rust Belt states that polls had confidently handed to Clinton.
Postmortems identified underweighting non-college-educated voters and misreading late-deciders, but the root was nonresponse bias: distrustful voters ignored surveys (AAPOR, 2018). This fueled distrust, with claims of a “stolen” election (Pew, 2016).
2.3 2020: Doubling Down on Failure
Despite methodological adjustments, 2020 polling significantly overestimated Joe Biden’s national advantage—predicting an 8–9 point lead when the actual margin was 4.5. In key battlegrounds, the average error climbed to 5.4 points, with 94% of polls overstating Democratic performance (e.g., Biden tied in Iowa; Trump won by 8). Response rates had dropped to 6%, deepening nonresponse bias among rural conservatives—a segment polling failed to reach. Weighting adjustments couldn’t correct for missing voters, and the 2020 cycle ultimately produced the largest polling error in four decades (AAPOR, 2021; AEI, 2024).

Very far from a one-off failure, the 2020 cycle proved what many had come to suspect: the flaws were not random, but structural. AAPOR rejected the standard explanations:
Late-deciding voters? No evidence.
Undecideds breaking Republican? Numbers didn’t support it.
Faulty education weighting? Already implemented
The real cause was unit nonresponse bias—entire voter groups, particularly rural and working-class conservatives, were simply unreachable by conventional polling methods. No amount of weighting could simulate voters who never entered the data stream. These voters aren't merely underrepresented; they're systematically not measured at all. Worse, they're not randomly distributed: they tend to vote Republican, don't trust institutions, and are becoming more disconnected from the media and polling environments.
What this implies is staggering: polling isn’t merely wrong at the margins—it’s faulty at the foundations. The information being gathered no longer precisely reflects the universe it's attempting to measure. It's like the thermometer's stopped gauging the room and began gauging only the individuals nearest it.
In a society that is based on mutual expectations and probabilistic trust, polling once was a powerful signal. In 2020, polling had become noise—persistent, loud, and misleading.
2.4 2024: Incremental Gains, Persistent Bias
By 2024, the polling industry had exhausted its margin for error. After two consecutive cycles marked by high-profile inaccuracies, polling organizations undertook what were billed as serious reforms. The industry moved to advanced modeling: Bayesian frameworks, MRP (multilevel regression with post-stratification), and deep voter-file calibration. None of it fixed the core problem. On the surface, these changes signaled methodological progress.
The results told a different story, though not as bad as the story of 2020.
Still national polling again overestimated Democratic performance—this time for Kamala Harris, who replaced Biden late in the cycle. Most polls and forecasters projected Harris to win the national popular vote by two points. Real Clear Polling showed the national race much closer. In any case, Trump won the national popular vote by 1.5 points.
Battleground polling showed Harris tied or leading in key battleground states, Michigan, Nevada, North Carolina, Wisconsin, and inexplicably, even Iowa. The Des Moines Register showed Harris leading Trump by three points just days before the election. Trump won Iowa by 13 points.
Although a full postmortem of the 2024 cycle is still underway, the outlines of the failure are already visible. The central issue is no longer the tools themselves, but the assumptions baked into them. Polling continues to model the electorate it expects or prefers to see, rather than the one that actually turns out to vote. This is not simply a technical misstep—it reflects a deeper epistemological problem.
Some pollsters excelled: Quantus Insights (0.7-point national error, 1.0-point error in MI/PA/WI October polls), Rasmussen, Trafalgar, InsiderAdvantage, Big Data Poll, and Atlas Intel (AFI Scorecard, 2024). Yet legacy firms like Marist, Siena/NYT, YouGov, and Morning Consult overestimated Kamala Harris’s lead by 2–3 points nationally and in key battleground states.
Preliminary AAPOR data point to persistent nonresponse bias among non-college conservatives (AAPOR, 2024). While 2024 showed progress, systemic flaws remain.
2.5 Signed Error: The Fingerprint of Bias
Errors are not random—they consistently overestimate Democrats.

Could volatility explain errors? No—90% of battleground polls skew Democratic, a statistical fingerprint of bias (AAPOR, 2021).
This widespread polling error reflects deeper methodological flaws, particularly in the failure to adjust for realignment and evolving voter behavior. Isakov and Kuriwaki (2020) highlighted how systemic nonresponse bias, especially among Trump supporters, persisted into 2020 because pollsters continued to rely on outdated weighting schemes that did not account for the shifting political landscape (Isakov & Kuriwaki, 2020). Similarly, Sohlberg and Branham (2020) found that polling inaccuracies were exacerbated in areas with significant changes in party vote share from previous elections—indicating that many pollsters overlooked contextual variables crucial to accurate forecasting (Sohlberg & Branham, 2020).
Similarly, Isakov and Kuriwaki (2020) highlighted that unaddressed nonresponse bias—especially when not corrected for shifts observed since 2016—systematically skewed battleground state polls toward Democratic candidates (Isakov & Kuriwaki, 2020). Together, these findings indicate that methodological oversights, particularly regarding dynamic political environments, are a key source of the observed polling bias.
2.6 From Measurement to Mythmaking
Polling’s consistent pro-Democratic error is not a glitch—it’s mythmaking. By modeling a fictional electorate, polls create illusions that misdirect campaigns, shape media narratives, and distort voter behavior, undermining democracy (Pew, 2023).
Perhaps most concerning, this pattern of error provides cover for those producing it. So long as inaccuracies can be framed as “within the margin” or blamed on “volatility,” the structural nature of the failure is obscured. Systemic bias is laundered through the language of statistical uncertainty.
The persistence of signed error reveals a deeper epistemological failure: the electorate that polling models aim to represent is not the one that turns out to vote. And for three consecutive election cycles, the deviation has not been neutral. It has systematically overstated Democratic support. This is not a mere inconvenience or technical shortfall. It is a crisis of inference.
3. Simulation Nation: Aggregators and Gatekeeper Harm
Aggregators like FiveThirtyEight, Nate Silver, and others turn flawed polls into probabilistic theater, selling certainty (Clinton 71% in 2016, Biden 87% in 2020, Harris 55% in 2024) built on bias. Across all three cycles, Trump outperformed FiveThirtyEight’s final national polling average by 3.0 to 3.7 points, consistently breaking the model’s assumptions about engagement, enthusiasm, and turnout elasticity.
The forecast didn’t fail because of volatility. It failed because of its own architecture—one that embedded bias at the structural level, amplified polling error rather than smoothing it, and rewarded the illusion of precision over actual accuracy.
Several studies have scrutinized the reliability of aggregated polling models like those from FiveThirtyEight, particularly in light of consistent underperformance by Republican candidates relative to forecasted outcomes. Smith (2018), for example, conducted an exploratory analysis of FiveThirtyEight’s 2018 midterm predictions and found that polling errors tended to overestimate Democratic support, reinforcing patterns observed in both 2016 and 2020.
Similarly, Isakov and Kuriwaki (2020) highlighted how systematic bias—particularly underestimating Trump’s support—persisted in battleground states due to structural nonresponse issues that aggregation failed to correct (Isakov & Kuriwaki, 2020). These critiques suggest that rather than mitigating polling bias, aggregators may amplify it under a facade of statistical rigor.
We are no longer seeing what the public thinks. We are seeing what forecasters think the public should think. This turns accuracy not only into a statistical objective, but a democratic imperative. And in recent history, that imperative has repeatedly gone unmet.
3.1 FiveThirtyEight’s Flawed Grading System
FiveThirtyEight’s A/B/C grading system created a false hierarchy of accuracy. A-rated pollsters like Siena and Quinnipiac were lauded despite consistent misses, while more accurate firms like Rasmussen were removed for “bias” and Trafalgar downgraded. This gatekeeping shielded failure and amplified signed error. FiveThirtyEight’s collapse in 2025 reflects its harm, but undoing its legacy will take years.
Although no longer affiliated with FiveThirtyEight, Nate Silver continues to exert outsized influence over how polling credibility is perceived—largely through a grading system he developed during his tenure at the site and continues to use in his independent forecasting. This system, while widely cited, remains opaque in methodology and unaccountable in practice, assigning perceived legitimacy to firms often disconnected from actual performance. The result is an entrenched gatekeeping mechanism: pollsters with demonstrable error are elevated, while more accurate challengers are excluded. Silver’s forecasts, built on the scaffolding of these subjective ratings, reinforce an illusion of statistical rigor—misleading the public into trusting “A-rated” polls as proxies for reliability, even when their track records tell a different story.
The impact has been significant: Polling misinformation, even if unintentional, became institutionalized. Audiences and media alike assumed an A-rated pollster was “accurate,” without understanding its directional bias, house effects, or historical error rate. In effect, the grading system produced a confidence illusion—legitimizing some of the least accurate work in the field while discrediting early challengers that were actually outperforming the incumbents. This has left a multi-cycle hangover effect: poll trust anchored to a defunct rating system that will take years—and real data literacy—to undo.
3.2 Gatekeeper Narratives
In October 2024, Nate Cohn of the New York Times dismissed emerging pollsters like Quantus Insights, SoCal Strategies, and Outward Intelligence, calling their methods “scant.” Yet Quantus and SoCal went on to outperform NYT/Siena in the same races—while Outward Intelligence, a firm used in Nate Silver’s forecast model, missed by seven points (Cohn, 2024; AFI Scorecard, 2024). Quantus publicly rebutted Cohn’s claims with real-time methodology disclosures on X and Substack, demonstrating a level of transparency that legacy outlets rarely match (Quantus Insights, 2024).
This kind of gatekeeping distorts public perception and deepens distrust when the polls inevitably fail. Legacy actors claim to clarify the data landscape, but in practice, their biases reward failure, entrench false hierarchies, and suppress methodological innovation (Pew, 2023).
The damage didn’t stop with presidential forecasts. The same flawed polling inputs and aggregator amplifications that misrepresented the top of the ticket cascaded through the rest of the ballot—shaping expectations, media coverage, and strategic decisions in Senate, gubernatorial, and House races. The errors were smaller, but the consequences were just as real.
4. Down-Ballot Distortions: Senate, Governors, and House
Polling errors in down-ballot races—Senate, gubernatorial, and House contests—continued to pose significant challenges in 2024, despite improvements in overall accuracy. While the average polling error decreased to 4.1 points in Senate races, the lowest in recent records, a persistent bias remained, with most polls underestimating Republican candidates. In Texas, however, Democratic Senate candidate Rep. Colin Allred lost to Republican Sen. Ted Cruz by 9 percentage points—nearly double the margin predicted by most final polls.
4.1 Senate (2020)
Polls overestimated Democrats:
Maine: Sara Gideon +5–6, Susan Collins +9 (14-point error).
South Carolina: Jaime Harrison competitive, lost by 10.
Iowa: Theresa Greenfield favored, Joni Ernst +7.
North Carolina: Cal Cunningham +2, Thom Tillis +2 (RealClearPolitics, 2020).

4.2 Governors (2018–2022)
Georgia 2018: Stacey Abrams polled close, Brian Kemp +8. Abrams’ claims of victory fueled distrust (Pew, 2018).
Florida 2018: Andrew Gillium led Ron Desantis by 4 points, DeSantis won by less than 1 point. (Quinnipiac showed Gillium leading by 7– 9 points).
Arizona 2022: Katie Hobbs +1–2, won by 0.4.
Nevada 2022: Steve Sisolak tied, lost by 1.5 (RealClearPolitics, 2022).
4.3 House (2024)
Polls predicted Democratic gains in Pennsylvania and Michigan; Republicans held seats, outperforming by 3–6 points (RealClearPolitics, 2024).
Errors cost $100M in Maine 2020 and $150M in Georgia 2018, driven by nonresponse bias and flawed models (FEC, 2024).
5. The Fallout: Strategic, Psychological, and Institutional Damage
Polling’s failures ripple across democracy. When flawed methodologies and biased aggregations shape public perception, they don’t just misinform—they influence campaign strategy, media narratives, voter behavior, and ultimately, election legitimacy. As trust in polling declines, so too does confidence in democratic processes built on the premise of informed choice. The illusion of precision created by legacy industry only deepens this erosion, packaging uncertainty as certainty and sidelining dissenting data that might better reflect electoral reality.
5.1 Strategic Fallout
Across recent cycles, polling failures have led to catastrophic strategic misfires—amounting to over $500 million in campaign misallocations. In 2020, Democrats poured nearly $100 million into South Carolina and Iowa based on polls showing competitive Senate races—both were double-digit losses. In 2024, the Harris campaign spent over $200 million in North Carolina, where polls showed a tie; Trump won by 3. And in 2018, $150 million flooded into Georgia, driven by overestimated Democratic performance (FEC, 2024). Senate and House candidates, misled by polling, ran conservative or defensive strategies—costing them winnable races (RealClearPolitics, 2024).
5.2 Psychological Fallout
Public polling often exerts behavioral effects through two mechanisms: the bandwagon effect, which increases support for perceived frontrunners, and the suppression effect, which depresses turnout among voters who perceive their vote as unnecessary or futile. In 2016, overconfident polling around Clinton contributed to lower-than-expected Democratic turnout in Wisconsin. Similarly, in 2024, polls showing Harris with a lead in Michigan led to demobilization among key Democratic constituencies (Mutz, 1998; ANES, 2016). The role of media amplification—via both cable networks and algorithmic platforms—further intensified these dynamics (Pew, 2023).

5.3 Institutional Fallout
Polling failure doesn’t just create bad data—it breeds political cynicism. When high-profile gatekeepers elevate flawed surveys, their credibility collapses alongside the numbers. The public remembers: 2016’s polling miss fed into the “Russia hoax” backlash; in 2018, polling overconfidence helped fuel Stacey Abrams’ claims of election mismanagement. According to Edelman (2024), media distrust now stands at 60%—up from 45% in 2016. Gallup (2024) reports polling trust has cratered to 22%, from 38% just eight years earlier. As polling errors accumulate, so does the sense that institutions can't be trusted to tell the truth—or to certify outcomes (Edelman, 2024; Gallup, 2024).

Some argue voters ignore polls due to fragmentation, but Pew (2023) shows media amplification shapes behavior (Pew, 2023). Compounded by an ecosystems that reinforce polling as pre-written history. Cable news graphics, “firewall” states, and forecast dashboards all contribute to a sense of inevitability—robbing elections of their contingency and voters of their agency.
6. A Civic Reckoning: The End of Measurement
Polling no longer measures the electorate—it simulates a cooperative, trusting subset, excluding rural, working-class, skeptical voters. This narrowed lens, amplified by gatekeepers, is not a technical flaw—it’s a civic breakdown, fueling distrust and misgovernance (Edelman, 2024).
At its best, polling is a mechanism of democratic accountability—a form of quantitative listening that amplifies public sentiment into political visibility. But today, it functions too often as a closed epistemic loop: a system that listens only to those already inclined to speak.
The result is a narrowed lens masquerading as a comprehensive view. From Senate contests to gubernatorial races to House districts, the pattern of signed error persisted across the electoral landscape. It cut across geography, office level, and media visibility.
These were not outliers. They were systemic distortions—generating false expectations and misdirecting political behavior at nearly every level of engagement.
This is not merely an error of method. It is an error of mission—a collapse of purpose, where tools built to reveal public will have instead begun to try and shape it and if not, simulate it.
If polling can no longer be trusted to observe the electorate, the question becomes existential: What replaces it? The answer isn’t minor adjustment—it’s structural reinvention. What follows is a blueprint for rebuilding public measurement from the ground up: not just a new model, but a new ethos.
7. Reconstruction: A New Paradigm for Polling
Fixing public polling requires dismantling gatekeeper influence and embracing methodological innovation. In its first cycle, Quantus Insights led the field: a 0.7-point national error, a 1.0-point average error in October battleground polling across Michigan, Pennsylvania, and Wisconsin, and 89% of all published polls falling within 3 points of the final result during the 2024 election cycle (Quantus Insights, 2024; AFI Scorecard, 2024). Our forecast correctly projected Trump’s 312 electoral votes—and, critically, modeled his exact 1.4-point margin in Michigan, even as our final state poll showed Harris narrowly ahead. That accuracy was not luck. It was structure.
7.1 The Quantus Framework
Quantus’ five models integrate behavioral and economic data:
Electorate Model: Bayesian priors simulate turnout, capturing non-college conservatives (e.g., 2024 Rust Belt accuracy).
Modus (and Modus Battleground) Model: Tracks voter sentiment, flagging late Republican enthusiasm in Wisconsin.
Consensus Model: Maps economic stress (e.g., CPI, real income) to Trump’s gains.
Polling Model: Corrects house effects and engagement skew.
Concordia Model: Transparent, falsifiable forecasts (65% Trump win probability) (Quantus Insights, 2024).
Where others smoothed over systemic bias with dense simulations, we built interpretability into every layer—and published it. Forecasts, assumptions, and post-election audits were public, testable, and traceable.
In a year where A-rated pollsters and traditional aggregators missed by 3 to 5 points, Quantus was right—on the outcome, the margin, and the map.
This is not a matter of style. It is a matter of structure.
7.2 Industry-Wide Reforms
In 2024, pollsters like Rasmussen, Trafalgar, InsiderAdvantage, Big Data Poll, HarrisX, Atlas Intel, Quantus Insights and SoCal Strategies delivered results with striking accuracy—outperforming the so-called “gold standard” firms from legacy media and universities (AFI Scorecard, 2024). These firms demonstrated that alternatives not only exist, but can surpass the institutional mainstays that continue to miss.
Reforms to Combat Systemic Bias in U.S. Polling
Independent Standards Body Create a U.S. equivalent to Canada's CRIC that overseas guidelines for transparency and methodological standards. Canada’s consistent 1.5-point error margins demonstrate how regulatory oversight could foster trust and accuracy (WAPOR, 2024).
Private-Nonprofit Collaboration
Encourage funding through nonpartisan industry consortia or philanthropic nonprofits rather than media outlets or campaigns, which often introduce demand bias. This could mirror models used in health or education research.Open-Source Polling Data Encourage pollsters to publish anonymized raw data, weighting schemes, and turnout models. Platforms like OpenICPSR or PollBase could serve as centralized repositories to facilitate third-party replication studies.
Voter Education Campaigns National media literacy efforts should explain how to interpret polling margins, turnout assumptions, and model uncertainty. Pew (2023) found that public misinterpretation of polls leads to strong bandwagon and disengagement effects (Pew Research Center, 2023).
Real-Time Transparency Dashboards A public-facing dashboard that tracks real-time pollster performance, modeled after “prediction market” feedback loops, could highlight which firms consistently miss and in which direction—encouraging methodological correction over time.
Ban or Cap Aggregator Influence on Grades Prohibit or limit aggregators from assigning public-facing grades without disclosing full scoring methodology, and require independent third-party review of such systems to prevent the circularity seen in FiveThirtyEight’s now-defunct ratings.
7.3 Advanced Methods
Rebuilding polling means reengineering how public opinion is modeled at its core. Traditional tools—static weighting, crude likely voter screens, and generic demographic balancing—are no longer sufficient. To correct for structural polling failure, firms must adopt a new technical standard. The Quantus framework integrates six advanced methodologies designed to mitigate systemic bias, model voter complexity, and calibrate in real time.
Multilevel Regression with Post-Stratification (MRP) enables granular estimation across intersecting demographic and geographic categories. By weighting opinion estimates across hundreds of strata, MRP corrects for chronic underrepresentation among rural, working-class, and institutionally skeptical voters—groups traditional pollsters often miss entirely (Hanretty, 2020).
Dynamic Bayesian Updating allows for continuous model refinement as new inputs emerge—from fresh polling to behavioral indicators to observed turnout shifts. Unlike static forecasts, Bayesian updating captures late-cycle movement and reduces lag error, especially during volatile final weeks of a campaign.
Propensity Score Adjustment estimates the likelihood that specific voter types—such as non-college rural conservatives—are under-sampled, then reweights accordingly. This method directly addresses nonresponse bias by treating it as a structural imbalance rather than random noise (Enamorado & Imai, 2018).
Turnout Modeling and Voter File Calibration replaces outdated likely-voter screens with individualized turnout probabilities based on real voter history. By anchoring expectations in the state-level voter file, this approach enhances turnout precision—particularly in swing states where participation varies dramatically between cycles.
Social Sentiment Integration leverages natural language processing tools across platforms like X (formerly Twitter) and Reddit to monitor narrative shifts, engagement spikes, and enthusiasm gaps. These real-time behavioral signals offer insight into voter motivation that conventional surveys often miss or detect too late.
Finally, Superpopulation Simulation and Stress Testing explores multiple electoral scenarios under varied assumptions—such as elevated turnout among politically disengaged voters or regional realignments. This process quantifies model fragility, identifies blind spots, and ensures forecasts are not built on brittle assumptions (Ahmed & Shabbir, 2019).
These techniques are not optional enhancements. They are the foundation of a post-crisis measurement regime. Without them, polling will continue to replicate the same blind spots that have discredited it. With them, public measurement can return to what it was meant to be: a clear, empirical window into democratic sentiment.
Together, these techniques offer scalable solutions to long-standing polling problems, enabling models to adapt to political realignment and modern media consumption habits.
7.4 Overcoming Challenges
Critics often claim that advanced modeling techniques are prohibitively expensive or impractical for most polling operations. But this assumption no longer holds. The increasing accessibility of AI tools, open-source modeling libraries, and public datasets has democratized high-accuracy forecasting. Quantus Insights is proof: by leveraging automation, machine learning, and behavioral calibration, it achieved a 0.6-point average error in Pennsylvania and Wisconsin during the 2024 cycle—without the institutional support or media resources of legacy firms (Quantus Insights, 2024).
Others argue that electoral volatility makes accurate modeling impossible. But again, the data contradicts the excuse. It’s not political calm that produces predictive precision—it’s methodological rigor. The problem isn’t that the electorate is too unpredictable. The problem is that most pollsters stopped trying to model it honestly.
9. Conclusion
The chronic failure of public polling has moved beyond methodological concern and now poses a structural threat to democratic legitimacy. Across three election cycles, the amplification of underperforming pollsters and the entrenchment of partisan bias by institutional aggregators have undermined public trust and distorted electoral accountability.
Yet the 2024 cycle offers evidence for recovery. Quantus Insights, with a 0.7-point national error and 1.0-point accuracy in key Rust Belt states, exemplifies what is possible when methodological rigor and transparency are prioritized. The success of other independent firms affirms that polling reform is achievable—and essential.
To rebuild polling as a functional civic instrument, institutional gatekeeping must be replaced with open, empirically grounded practices. Without this shift, polling will remain a source of misperception, not public insight—deepening the legitimacy crisis rather than resolving it (Edelman, 2024).
References
AAPOR. (2000). Response Rate Trends, 2000.
AAPOR. (2016). 2016 Election Polling Report.
AAPOR. (2018). Kennedy et al., Postmortem Analysis.
AAPOR. (2021). 2020 Election Polling Postmortem.
AAPOR. (2023). Role of Public Opinion in Democracy.
AAPOR. (2024). Preliminary 2024 Postmortem.
AFI Scorecard. (2024). America First Insight Pollster Scorecard.
Cohn, N. (2024). New Pollsters Lack Credibility. The New York Times.
Edelman. (2024). Trust Barometer 2024.
FEC. (2024). Campaign Spending Data, 2016–2024.
Gallup. (2024). Confidence in Polls, 2000–2024.
Isakov & Kuriwaki (2020). Study analyzes polling errors from the 2020 U.S. presidential election using a "data defect index"
Mutz, D. (1998). Bandwagon Effects in Elections. Political Behavior.
NYT. (2024). Polling Changes for 2024.
Pew. (2016). Election Distrust Post-2016.
Pew. (2018). Georgia Gubernatorial Election Analysis.
Pew. (2023). Media Amplification of Polls.
Pew. (2024). 2020 Voter Turnout Estimates.
Quantus Insights. (2024). 2024 Election Metrics.
RealClearPolitics. (2020, 2022, 2024). Polling Averages and Errors.
Smith (2018). Study showed evidence of being systematically skewed towards the Democratic candidate, overestimating their actual performance.
Sohlberg & Branham (2020). Confirms that significant shifts in party support from previous elections can increase polling errors,
WAPOR. (2024). International Polling Standards.
Excellent job on this!