Understanding Trump's Poll Data Using Fibonacci Retracement: Analyzing Trends and Voter Support
Deciphering Poll Trends: A Fibonacci Approach to Voter Support
In the realm of political analysis, interpreting polling data accurately is crucial for understanding voter behavior and predicting election outcomes. One sophisticated yet insightful method for analyzing such data is through the application of Fibonacci retracement levels. This essay delves into the process of applying Fibonacci principles to analyze President Trump's polling data, providing an informative yet accessible explanation of the method and its implications. (To see Biden’s Fibonacci retracement levels see our X (twitter) post here).
The Fibonacci Sequence and Its Relevance
The Fibonacci sequence, a series of numbers where each number is the sum of the two preceding ones (e.g., 0, 1, 1, 2, 3, 5, 8, 13, etc.), is more than a mathematical curiosity. The ratios derived from this sequence (23.6%, 38.2%, 50%, 61.8%, and 100%) are widely used in financial markets to identify potential support and resistance levels. These ratios are valuable because they reflect natural patterns of growth and retracement, which can also be applied to polling data to gain insights into voter support trends.
Applying Fibonacci Retracement to Polling Data
To apply Fibonacci retracement to Trump's polling data, we first calculate the moving averages to smooth out short-term fluctuations and highlight the underlying trends. For this analysis, we used a window size of 5 polls, providing a clearer picture of the general trend in voter support.
High and Low Points from Moving Averages:
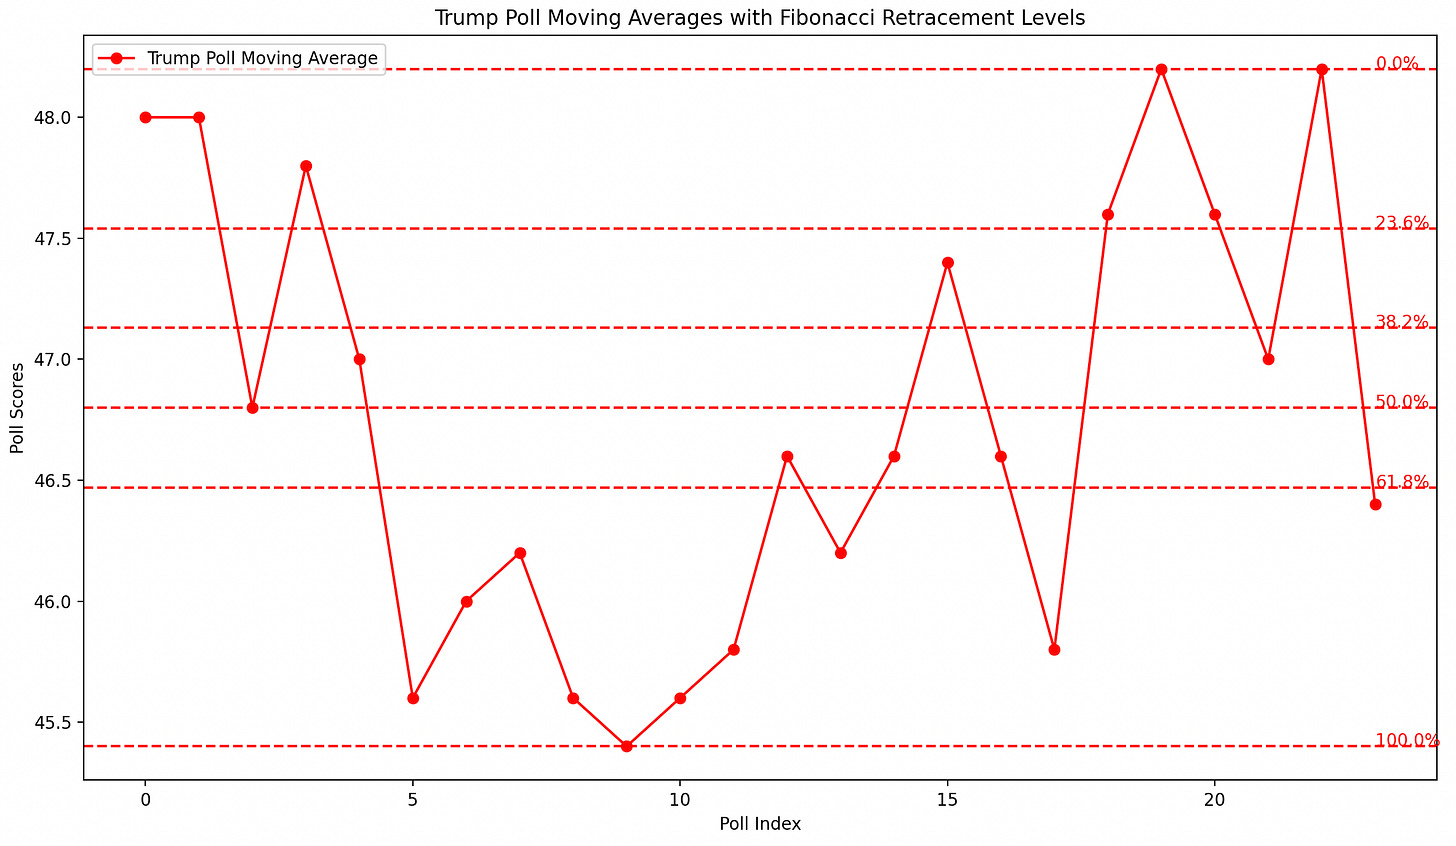
High (0% retracement): 48.2%
Low (100% retracement): 45.4%
Using these high and low points, we calculate the key Fibonacci retracement levels:
23.6% Retracement: 47.50%
38.2% Retracement: 47.08%
50% Retracement: 46.80%
61.8% Retracement: 46.52%
Interpreting the Graph and Fibonacci Levels
The graph illustrates Trump's poll moving averages with the Fibonacci retracement levels applied. Each level serves as a potential area of support or resistance, indicating where Trump's poll numbers might stabilize or face challenges.
High Level (0%) - 48.2%: This level represents the maximum observed voter support. It acts as a strong resistance point, suggesting that it would require significant momentum for Trump's support to break above this level.
23.6% Retracement - 47.50%: This level can act as initial support if Trump's poll numbers fall from the high. It might also serve as resistance if the numbers rise towards it. Stabilizing around this level indicates a strong base of voter support.
38.2% Retracement - 47.08%: A more significant retracement level, indicating moderate support if Trump's numbers stabilize here after a fall, or resistance if they approach this level from below.
50% Retracement - 46.80%: Often considered a critical psychological barrier. Holding above this level suggests balanced support, while falling below it might indicate weakening support.
61.8% Retracement - 46.52%: Known as the "golden ratio," this level acts as strong support. Rebounding from this level indicates very strong underlying support, while approaching it from below signifies significant resistance.
Low Level (100%) - 45.4%: The lowest level observed, representing the floor of support. Falling to this level and rebounding suggests a strong support base.
Practical Implications
Identifying Support Levels:
46.52% (61.8%) and 46.80% (50%): Critical support points. If Trump's poll numbers fall to these levels and rebound, it suggests strong voter support.
Strength and Stability: Maintaining support above these levels indicates a stable and robust voter base.
Identifying Resistance Levels:
47.08% (38.2%) and 47.50% (23.6%): Likely resistance points. If Trump's poll numbers are rising, these levels might act as barriers, making it challenging to gain further support.
Strategic Insights:
Campaign Focus: Focus on maintaining support above the 46.52% and 46.80% levels. Efforts can be made to break through the 47.08% and 47.50% resistance levels to increase voter approval.
Monitoring Trends: Regularly monitor Trump's poll numbers around these Fibonacci levels to anticipate potential changes in voter sentiment. Rebounding from support levels or breaking through resistance levels would provide insights into the campaign's effectiveness.
Conclusion
Using the Fibonacci retracement levels to analyze Trump's polling data provides a structured approach to identifying key support and resistance levels. This method helps in understanding the stability of voter support, planning strategic actions to maintain or enhance voter approval, and anticipating potential changes in voter sentiment. By focusing on these key levels, political analysts and campaign strategists can gain a clearer picture of the underlying trends in voter support, allowing for more informed decisions and effective campaign strategies.


